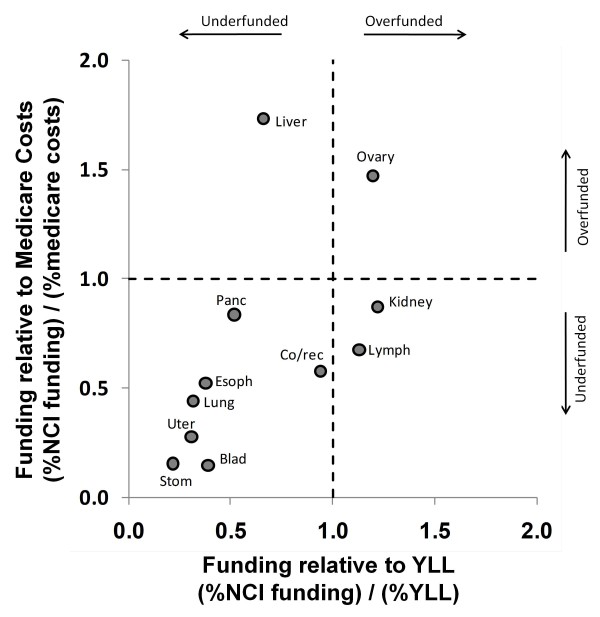
Figure 6.
NCI research funding relative to Medicare payment costs[[20]]and YLL. Dashed lines indicate borders between regions that are underfunded (%funding < % cost or %YLL) and overfunded (%funding > % cost or %YLL). Several cancers have funding ratios exceeding 2.0 for one axis or the other and are therefore considerably overfunded according to the criteria corresponding to that axis. To focus on underfunded cancers, those cancers (breast, leukemia, melanoma, prostate, and brain/cns) are not depicted. Note also that economic data for myeloma, oral cancer and testes cancer was not available and the lymphoma data represents both Hodgkin's and non-Hodgkin's lymphomas combined.

