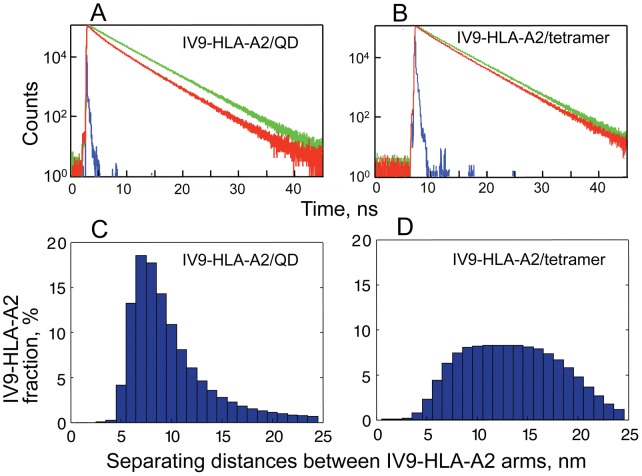
Figure 3. Distribution of separating distances between IV9-HLA-A2 proteins assembled on QD and Streptavidin scaffolds.
Fluorescence decay of AF594-IV9 peptide bound to HLA-A2 protein (donor) in the presence or absence of AF647-IV9-HLA-A2 protein (acceptor) displayed on the surface of QD(520) (A) or Streptavidin scaffold (B). Fitting the experimental data to the model (Eqs. 1–7) yielded satisfactory fit (χ2<1.2) allowing to evaluate distribution of separating distances between IV9-HLA-A2 molecules displayed on QD (C) or Streptavidin (D).

