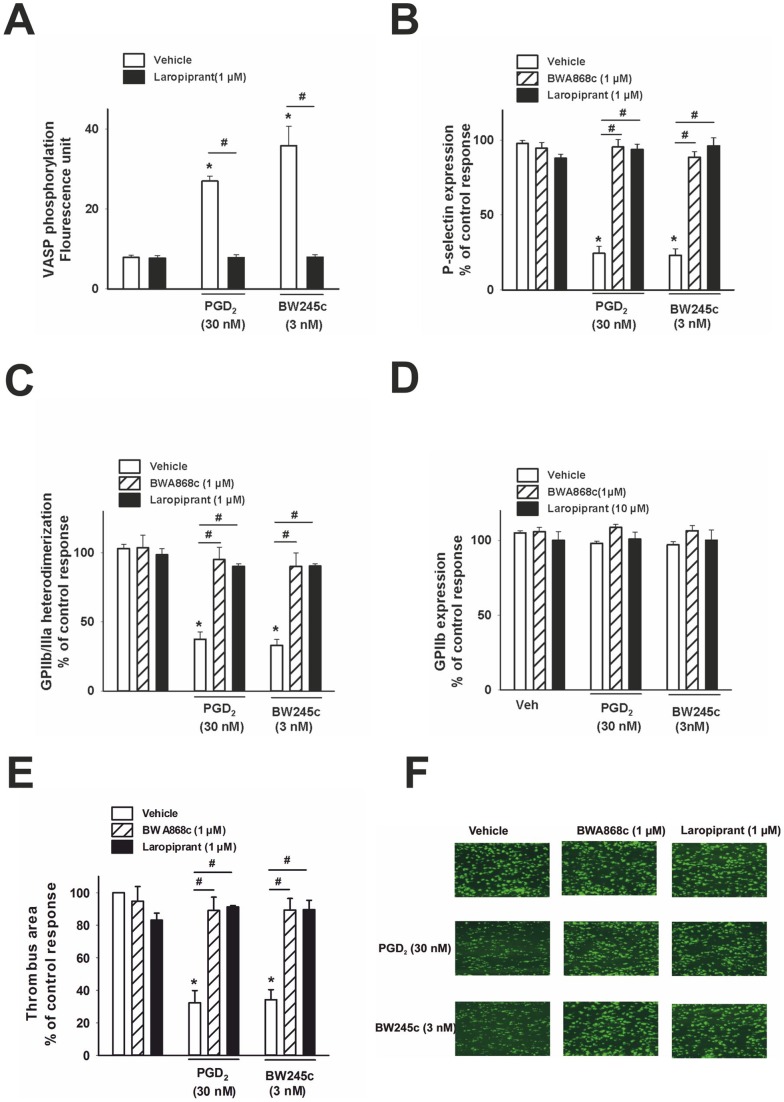
Figure 2. DP receptor activation increases VASP phosphorylation, and inhibits P-selectin expression, GPIIb/IIIa activation and in vitro thrombus formation. (A).
VASP phosphorylation was visualized using an anti-VASP p-Ser 157 antibody in flow cytometry and data were expressed in fluorescence units. VASP phosphorylation in platelets stimulated with ADP (3 µmol/L) was significantly enhanced by PGD2 (30 nmol/L) as well as the DP agonist BW245c (3 nmol/L), which was completely prevented by pre-treatment of platelets with laropiprant (1 μmol/L) (n = 4). (B) ADP (3 μmol/L) increased the surface expression of P-selectin, detected using a CD62P antibody, in platelets primed with cytochalasin B (5 μg/mL). PGD2 (30 nmol/L) and BW245c (3 nmol/L) caused a significant inhibition of P-selectin expression on the platelet surface and this effect was revoked by pre-treatment with DP antagonists, BWA868c (1 μmol/L) and laropiprant (1 μmol/L; n = 6). (C) The ADP (3 μmol/L) induced activation of GPIIb/IIIa, detected using a conformation dependent antibody PAC-1, was attenuated by PGD2 (30 nmol/L) and the DP agonist BW245c (3 nmol/L). These effects were reversed by BWA868c and laropiprant at 1 μmol/L (n = 6). (D) GPIIb expression was determined using an anti-CD41 antibody by flow cytometry. None of the treatments affected the GPIIb expression. Data were expressed as percent of control ADP response. (E) Whole blood incubated with the fluorescent dye 3,3′-dihexyloxacarbocyanine iodide was perfused over collagen-coated channels and thrombus formation was recorded by fluorescence microscopy. Thrombus-covered area was calculated by computerized image analysis and is expressed as percent of control (vehicle) response. Vehicle-treated samples showed pronounced thrombogenesis over collagen. Both PGD2 (30 nmol/L) and BW245c (3 nmol/L) markedly decreased the formation of thrombi. The DP antagonist BWA868c and laropiprant (1 µmol/L each) had no effect on thrombus formation by themselves but reversed the inhibition of thrombogenesis by DP receptor stimulation (n = 4). (F) Original fluorescence images. Values are shown as mean+SEM. *P<0.05 as compared to vehicle and # P<0.05 as compared to agonist treatment.

