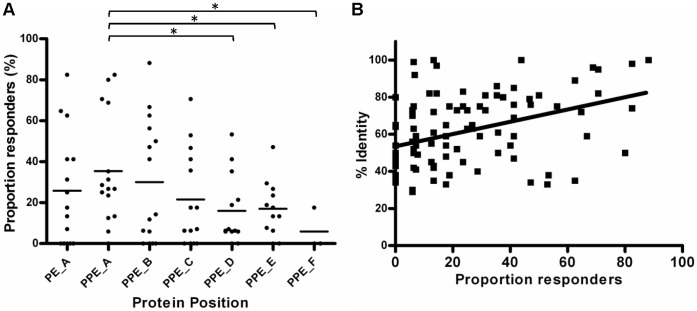
Figure 5. Immune recognition correlates with sequence conservation.
(A) IFN-γ responses were measured following stimulation of whole bovine blood with PE/PPE peptide pools, and scored as positive if ΔOD450 values were ≥0.1. The proportion of responders was plotted along the length of the PE/PPE proteins, where A corresponds to the peptide pool closest to the N-terminal. *, 2-tailed p value <0.05 (unpaired t-test). The letters A to F denote the position of the peptide pool across the length of the protein, with A nearest the N-terminal. PE_A represents the conserved 110 aa region, while PPE_A and PPE_B encompasses the conserved 180 aa region of the PPE proteins. (B) The proportion responders to PE/PPE peptide pools was plotted against % identity, which corresponds to the % identity of the amino acid sequence corresponding to that pool to its closest match in the M. tuberculosis genome sequence. Linear regression analysis produced the line shown. A Spearman correlation test indicated revealed a statistically significant correlation between % identity and proportion bovine responders; rho(98) = 0.401, 2-tailed p value <0.0001.

