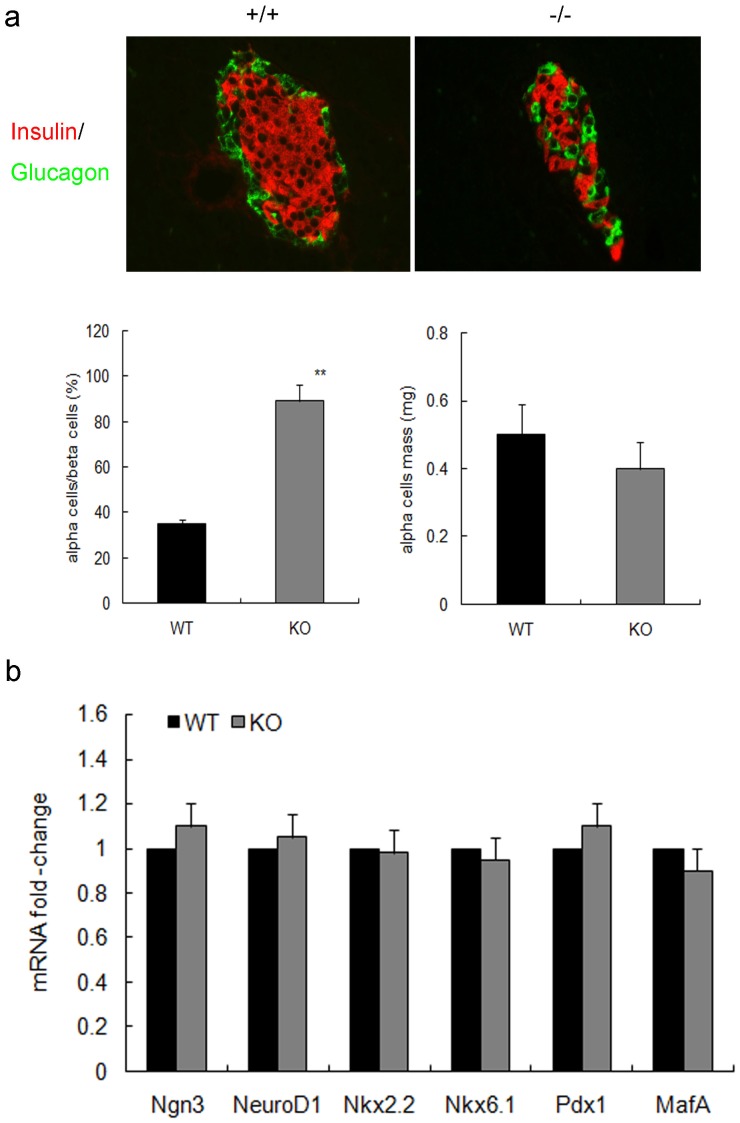
Figure 6. Islet development in RIPcre+survivinfl/fl mice and controls after PDL.
(a) In day 7 PDL pancreas, insulin and glucagon positive cells show abnormal distribution in the mutant mice (upper panel, original magnification, ×400). Quantification reveals that the knockout islet has a markedly higher proportion of alpha cells to beta cells as compared with controls (lowerleft panel). But alpha cell mass is similar in the two groups (lower right panel) (n = 5 per genotype). (b) Fold change in the expression of the indicated genes related to islet neogenesis as determined by quatitative PCR are similar in day 7 PDL pancreas in the mutant mice (gray bars) compared with controls (black bars) (n = 5 per genotype). WT, wildtype; KO, knockout. The data represent as means ± SE. **p<0.01 vs control.

