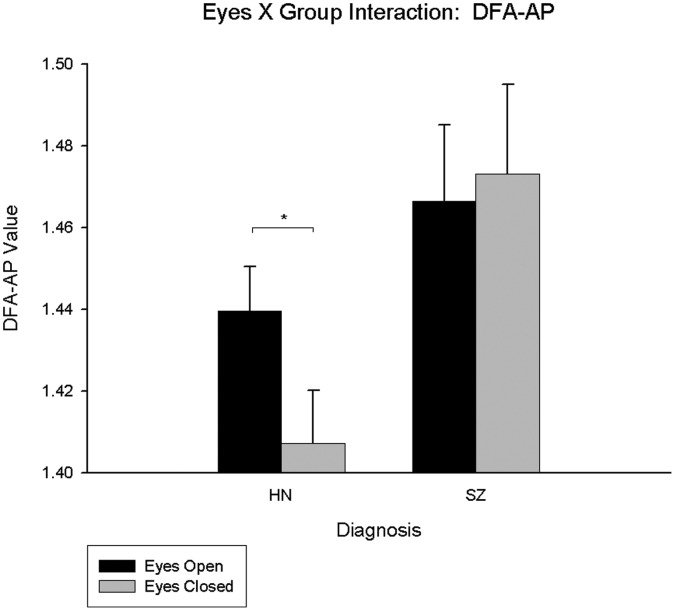
Figure 4. Eyes X group interaction for non-psychiatric controls and singly diagnosed schizophrenia participants for DFA-AP.
The HN bars represent the data for the healthy non-psychiatric controls and the SZ bars represent the data for singly-diagnosed participants with schizophrenia; significant pair-wise comparisons are starred.

