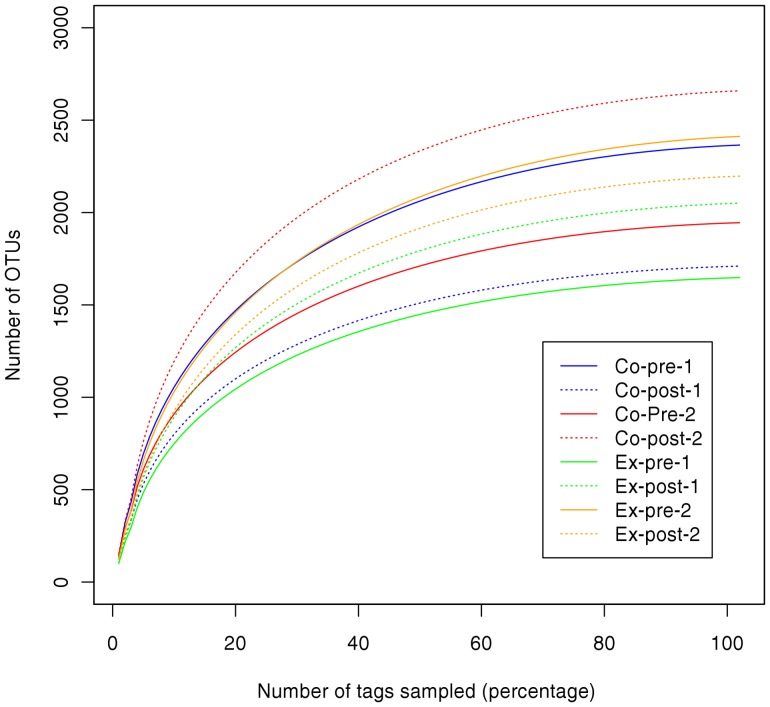
Figure 1. Rarefaction analysis for each sample based on clustering of high quality de-noised reads.
In total samples from four patients were analyzed two times, i.e., before (continuous lines) and two months after intervention (dashed lines). Two control group patients (Co) were treated by SRP alone whereas two experimental group patients (Ex) received SRP plus adjunctive antibiotics. Lines are colored according to the sample origin.

