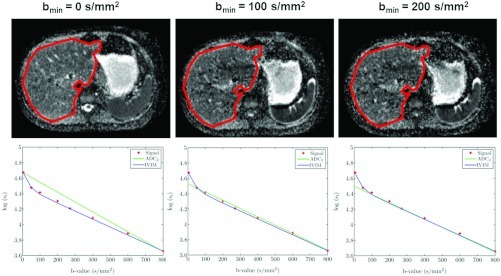
Figure 1.

Representative ADC maps (first row) and liver (encircled) signal-decay plots (second row) organized according to the minimal b-value used to calculate the ADC. The ADC maps were calculated using the ADC2 estimator with fixed bmax = 800 s/mm2 and varying bmin. The discrepancy between the ADC2 and the slow-diffusion component of the IVIM model (ADCIVIM) decreases as the bmin increases.
