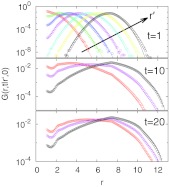
Figure 2.
Green's functions G(r, t|r ′, 0) from simulations (symbols) and diffusion model (lines). G(r, t|r ′, 0) is shown as a function of the pair distance r at packing fraction ϕ = 0.325. We use an observation time of t = 20 to obtain diffusion model parameters, combining results for lag times Δt = 1, 2, …, 20. The arrow in the top panel reflects increasing r ′ = 1, 2, …, 7. Same color scheme is used for middle and bottom panels.

