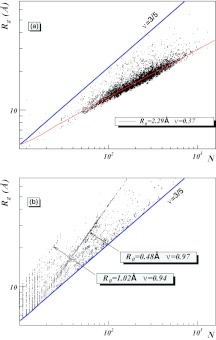
Figure 2.
(a) The (N, Rg) distribution of all individual single-chain PDB proteins with resolution less than 2.0 Å and with less than 30% homology. The lower line (ν = 0.37) describes mostly α-helical proteins and the top line is a ν = 3/5 Flory line. There are practically no single-chain proteins above the Flory line. (b) The (N, Rg) distribution for all multi-chain proteins from the current PDB that are above the Flory line. The two clusters given by equation 38, are clearly visible. The values of R0 and ν shown in the graphs were determined by linear regression.

