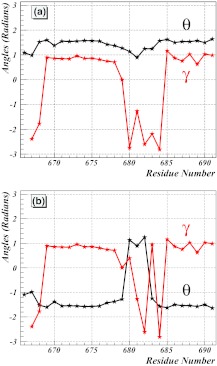
Figure 6.
(a) The spectrum of backbone virtual-bond angles θi (black line) and virtual-torsion angles γi (red line) for the AICD component of 3DXC (chain B). (b) The same spectrum after application of the transformation of Eq. 22 to reveal the soliton structure. The sites are indexed with residue numbers from the PDB.

