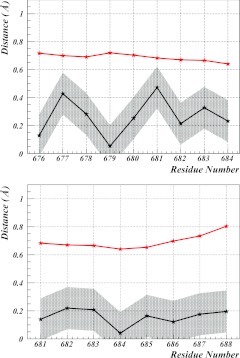
Figure 7.
The two solitons of 3DXC. Residues are indexed with the numbers from the PDB structure. The black line denotes the residue-wise difference between the coordinates computed from the soliton and those computed from the PDB conformation. The red line denotes the Debye-Waller (one standard deviation) fluctuation distance, computed from the B-factors in the PDB. The grey area describes the estimated 0.15 Å zero-point fluctuation distance around the solitons.

