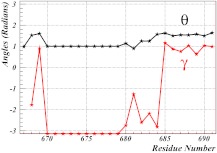
Figure 9.
The (θi, γi) profile of the 3DXC (chain B) after propagation of the first soliton onto the proline at site 669. See Figure 6 for the initial spectrum. The black lines and symbols correspond to the virtual-bond angles θ and the red lines and symbols correspond to the virtual-bond dihedral angles γ, respectively.

