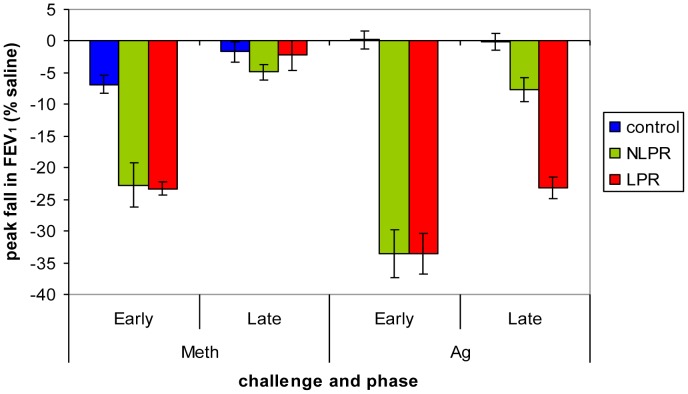
Figure 2. Peak fall in FEV1 following Meth and Ag challenge.
Group x time x challenge interaction for peak fall in FEV1 (F(2,24) = 8.92, p = .001). Following Meth challenge, the LPR and NLPR groups showed a significantly greater early phase peak fall in FEV1 than the control group (LPR vs. Control: t(17) = −9.28, p<.001; NLPR vs. Control: t(15) = −4.43, p<.001), but the two groups of asthmatics did not differ (t(16) = −.17, p = .87). Lung function did not differ across groups during the late phase period after Meth challenge (F(2, 24) = .79, p = .47). Following Ag challenge, the LPR and NLPR groups again showed similar early phase peak falls in FEV1 (t(16) = −.01, p = .99) that were significantly greater than that of the control group (LPR vs. Control: t(17) = −9.40, p<.001; NLPR vs. Control: t(15) = −8.70, p<.001). During the late phase period, however, the LPR group showed a greater peak fall in FEV1 compared to both the NLPR (t(16) = −6.13, p<.001) and control groups (t(17) = −10.55, p<.001), whereas the NLPR group showed a peak fall between that of the LPR and control group (NLPR vs. Control: t(15) = −3.35, p = .004). Error bars represent standard error of the mean.

