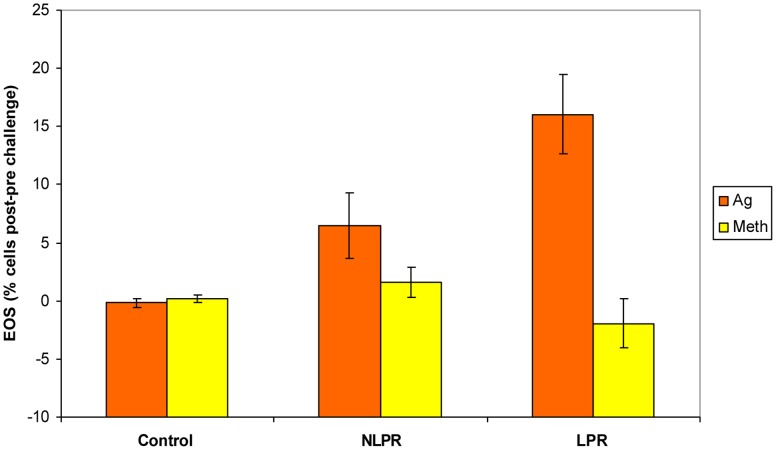
Figure 3. Greater percentage of sputum EOS during Ag challenge in late-phase responders.
Percentage of sputum eosinophils 24 h post-challenge relative to pre-challenge (group x challenge interaction; F(2,24) = 8.16, p = .002). The increase in EOS for the LPR group was greater than that of both the NLPR (t(15) = 2·13, p = .05) and controls (t(17) = 4.95, p<.001) following the Ag challenge. The NLPR group showed a small, but significantly greater increase in EOS than controls (NLPR vs. Control: t(16) = 2.64, p = .018). No group differences were present following the Meth challenge (LPR vs. NLPR: t(15) = −1.38, p = .19; LPR vs. Control: t(17) = −1.07, p = .30; NLPR vs. Control: t(16) = 1.16, p = .26). Error bars represent standard error of the mean.

