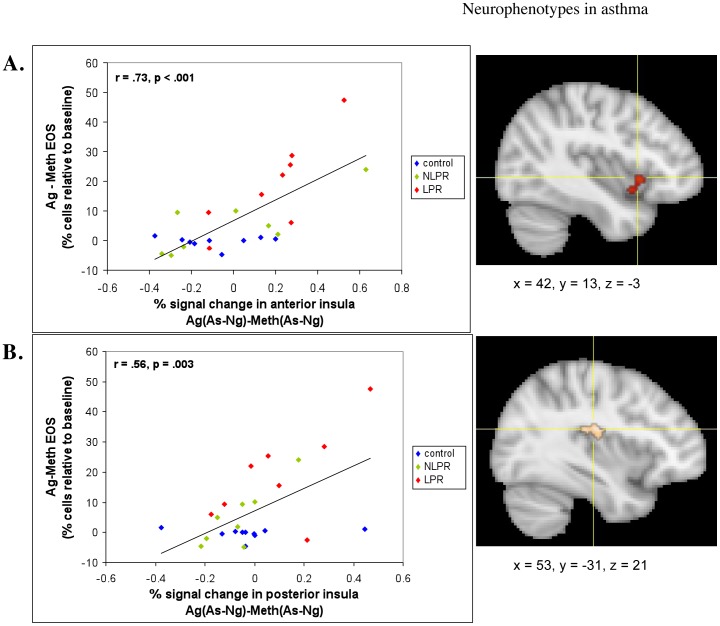
Figure 6. Insula activity predicts peripheral measures of inflammatory potential.
Percent signal change in the (a) anterior (r = .73, p<.001) and (b) posterior (r = .56, p = .003) insula in response to asthma, compared to negative words, during antigen, relative to methacholine challenge (Ag[As-Ng]-Meth[As-Ng]) and percentage of EOS in sputum during late phase antigen relative to methacholine challenge [Ag-Meth]. Coordinates are in MNI space.

