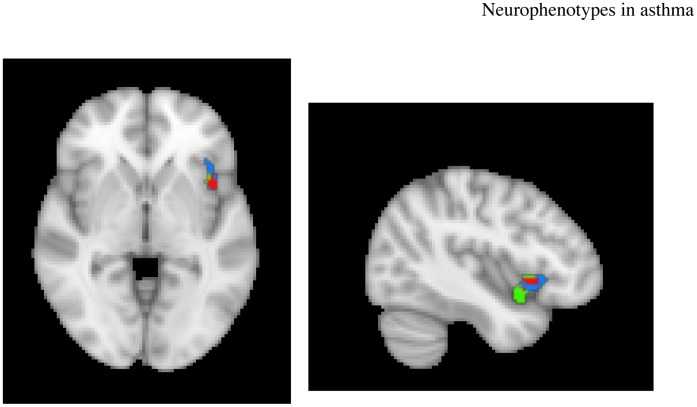
Figure 7. Overlap in voxels in the right anterior insula between the cluster showing a group x challenge x valence interaction and the cluster showing a correlation with increase in sputum eosinophils during Ag challenge.
Red voxels indicate the area of overlap; blue voxels belong to only the cluster showing a 3-way interaction; green voxels belong to only the cluster showing the correlation with eosinophils.

