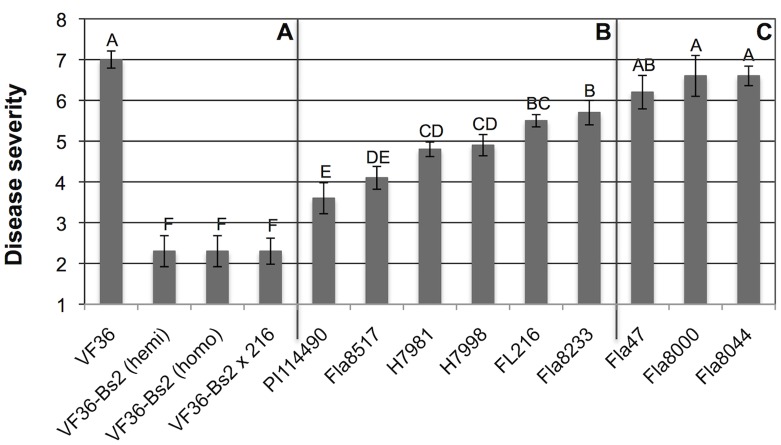
Figure 1. Comparison of bacterial spot disease severity among transgenic and disease resistant tomato genotypes.
Results of field trials in Citra and Balm, FL, 2006-7. Data are overall mean disease severity scores from three field trials (Table S4). Panel a: VF 36 lines without Bs2 or with one (hemi, and VF36-Bs2 x 216) or two (homo) copies of the Bs2 gene; Panel b: tomato breeding lines with resistance to bacterial spot disease; Panel c: tomato lines susceptible to bacterial spot. Disease severity was determined by the Horsfall-Barratt defoliation scale (1 = 0%; 2 = 0–3%; 3 = 3–6%; 4 = 6–12%; 5 = 12–25%; 6 = 25–50%; 7 = 50–75%; 8 = 75–87%; 9 = 87–93%; 10 = 93–97%;11 = 97–100%; and 12 = 100% defoliation) [14]. Error bars denote standard errors of the mean. Letters above bars indicate statistically significant differences in mean values.

