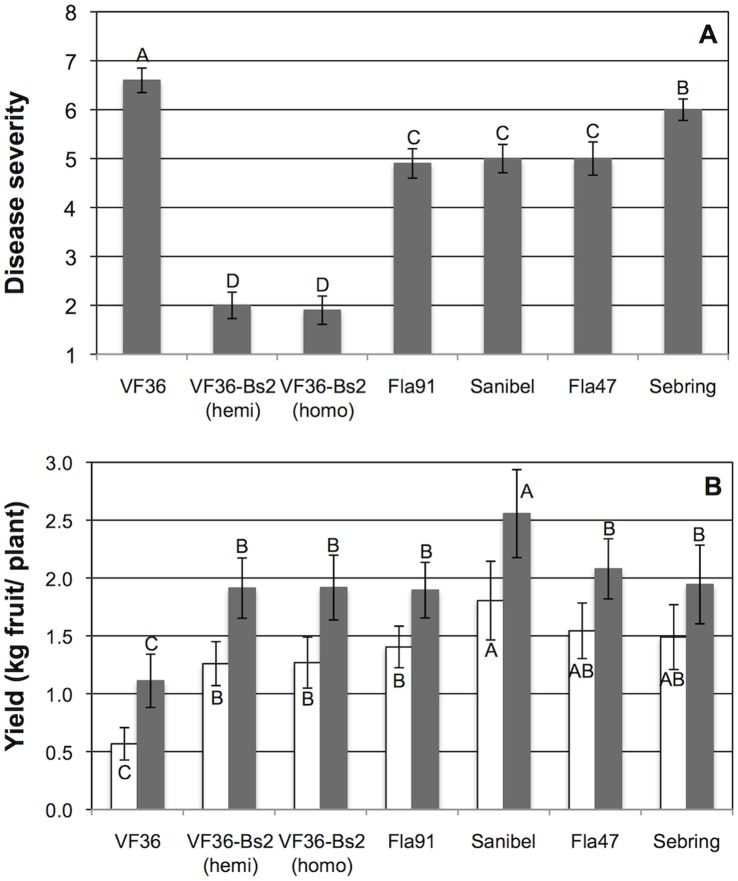
Figure 2. Comparison of disease severity and yield in transgenic and commercial tomato varieties.
Results from Balm, FL, field trials, 2007–2010. Data shown are the combined analysis of five trials (Table S6), derived from the individual trial results given in Table S5. a: Bacterial spot disease severity. Disease severity was determined by the Horsfall-Barratt defoliation scale (See Fig. 1 legend) [14]. Error bars denote standard errors of the mean. Letters above bars indicate statistically significant differences in mean values. b: Yield. Marketable yield (open bars) is kg per plant for medium, large, and extra large fruit. Total yield (filled bars) is kg per plant for marketable yield plus small fruit and culls. VF 36 lines have no (VF36), one (VF36-Bs2 hemi) or two (VF36-Bs2 homo) copies of the Bs2 gene. Error bars denote standard errors of the mean. Letters above bars indicate statistically significant differences in mean values for total yield data, whereas letters below bars indicate significant differences in mean values for marketable yield data.

