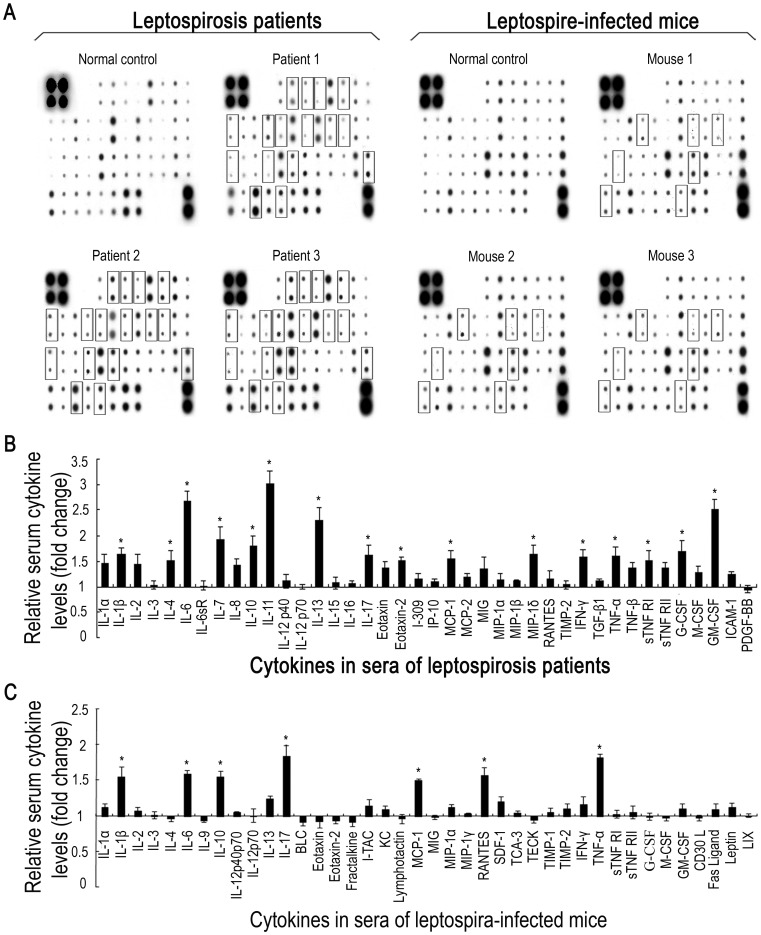
Figure 1. Cytokine profiles in sera from leptospirosis patients and leptospire-infected mice.
(A). Protein array detection of cytokines in sera from leptospirosis patients within three days after disease onset and C3H/HeJ mice infected with L. interrogans Lai strain for 48 h. The hybridization blots within squares indicate the cytokines with significant elevation (≥1.5 fold) in all the serum specimens from leptospirosis patients compared to that in the pooled sera from three healthy individuals, or from leptospire-infected mice compared to that in pooled sera from three uninfected mice. (B). Statistical summary of the cytokine profile of the sera from leptospirosis patients. Statistical data from the cytokine array detection such as shown in A (leptospirosis patients). Bars show the levels of different cytokines with mean ± SD in the sera of three leptospirosis patients. The levels of cytokines in pooled serum from three healthy individuals were set as 1.0. *: cytokine level significantly elevated (≥1.5 fold) compared to that in the pooled serum from three healthy individuals. (C). Statistical summary of the cytokine profile of the sera from leptospire-infected mice. Statistical data from the cytokine array such as shown in A (leptospire-infected mice). Bars show the levels of different cytokines with mean ± SD in the sera of three leptospire-infected mice. The levels of cytokines in pooled serum from three uninfected mice were set as 1.0. *: the cytokine level significantly elevated (≥1.5 fold) compared to that in the pooled serum from three uninfected mice.

