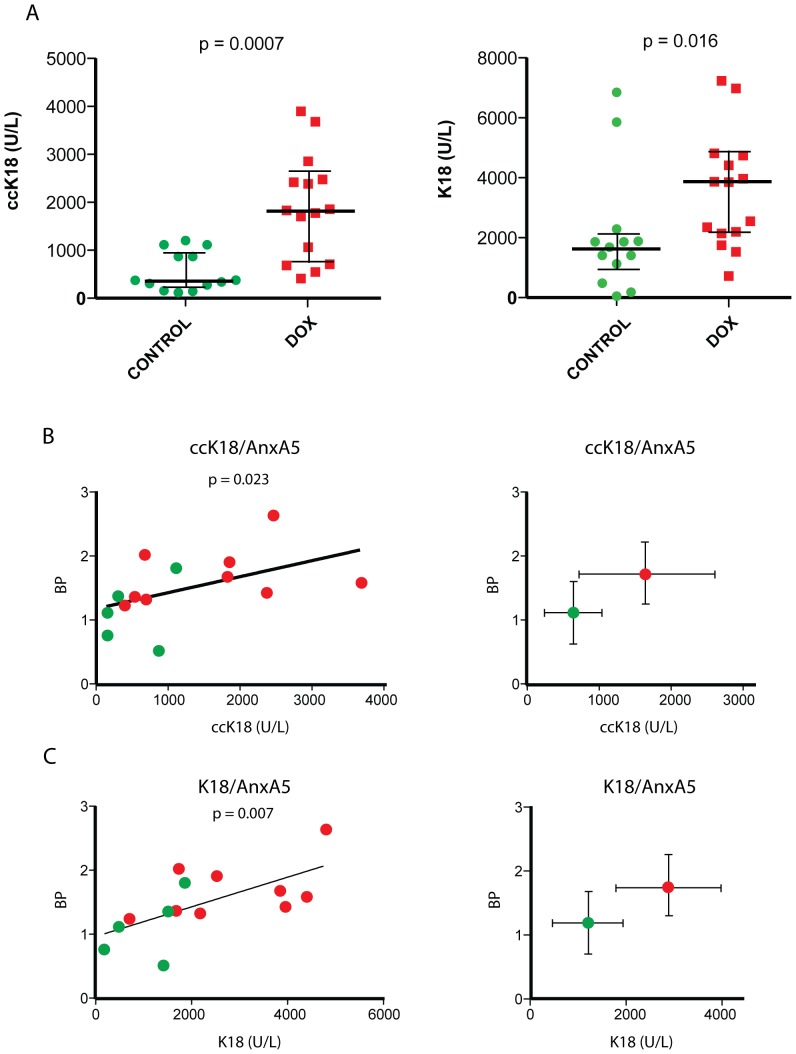
Figure 4. Correlations between increases in serum marker levels and tumor [11C]-AnxA5-ST binding potentials upon doxorubicin treatment.
A ) Levels of ccK18 (M30 Apoptosense®) and K18 (M65®) determined in plasma of mice carrying FaDu xenograft tumors, either with (red symbols) or without (green symbols) prior doxorubicin treatment for 72 h. Statistical significance as given in the panels was determined by the Mann-Whitney U test. B,C ) Correlations between tumor binding potential in PET imaging using the [11C]-AnxA5-ST tracer and B ) ccK18 and C ) K18 plasma levels for each mouse. Shown to the left in each panel are values of individual mice with the p-values of statistical analysis of correlation as performed using the Spearman rank test given in the graphs. The plots to the right show the aggregated means ± S.D. Red symbols: doxorubicin-treated mice; green symbols: untreated mice.

