
Figure 3. H2O2 treatment of TcOGG1-overexpressor T. cruzi.
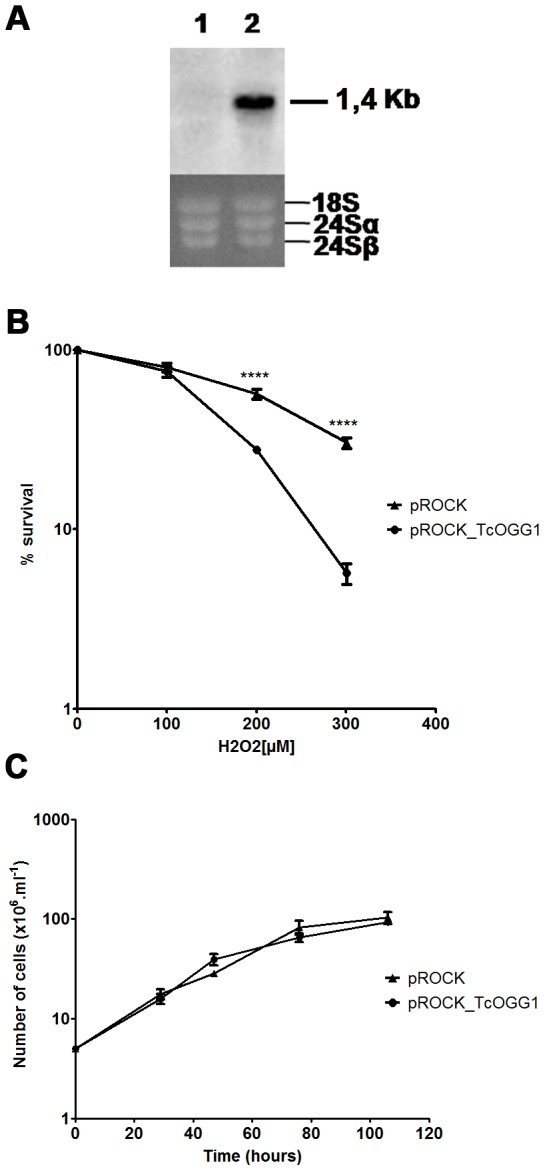
A) Northern blot analyses of CL Brener strain transfected with empty vector (1) or with pROCK_ TcOGG1 (2). Total RNA was extracted and probed with TcOGG1 DNA. The agarose gel stained with ethidium bromide shows total RNA extracted from these parasites. B) T. cruzi OGG1 -overexpressor survival curve after H2O2 treatment. Parasites were treated with different H2O2 doses and after 3 days were counted. Survival percentage was measured in relation to untreated cells. C) T. cruzi OGG1 -overexpressor growth curve. Cells were counted in certain time intervals through a period of approximately 100 hours. The curves are the average of three independent experiments, each one in triplicate. Bars represent SEM. Statistical analysis used was unpaired t test. CL Brener strain transfected with pROCK (▴) or with pROCK_TcOGG1 (•). **** - P value<0,0001.