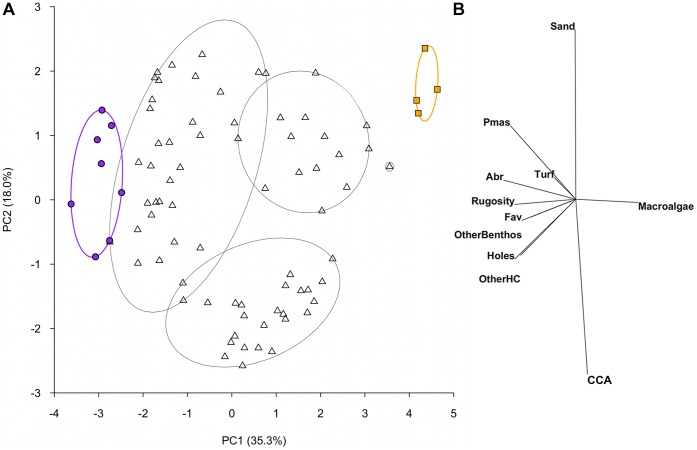
Figure 1. Principal components analysis of benthic habitat variables.
(A) Spatial variation in benthic habitat on reefs at the transect level, shown for the first two components from a principal components analysis on natural log(x+1) transformed and normalised data. Ellipses show groupings calculated from a slice taken through a hierarchical cluster analysis at a Euclidean distance value of 4. Data symbols represent transects within reefs; filled circles and squares highlight transects within the extreme clusters for visualisation purposes. Purple circles and ellipse shows high complexity coral cluster consisting of 8 transects from 2 reefs; orange squares and ellipse shows low-complexity, high macroalgae cluster consisting of 4 transects from 1 reef; triangles are transects that fall within intermediate clusters. (B) The relative contribution of the 11 benthic habitat categories to the observed variation in reef benthic condition. Pmas – massive Porites; Abr – branching Acropora; Fav – favids; OtherBenthos – non-coral or algae benthic organisms; OtherHC – all other scleractinian corals; CCA – crustose coralline algae.

