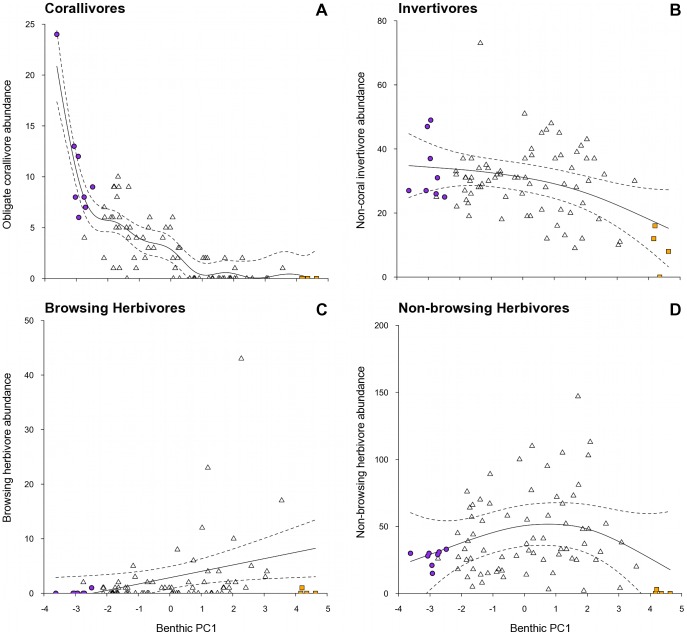
Figure 4. Relationships between the gradient in benthic habitat condition and abundances of fish functional groups.
Benthic habitat condition (PC1 axis): low values – complex coral habitats; high values – low-complexity macroalgae habitats. Abundances of fish functional groups: (a) obligate corallivores, (b) non-coral invertivores, (c) browsing herbivores, and (d) non-browsing herbivores. Plotted are fitted parameter estimates ±95% confidence intervals based on GAM with Reef as a random variable. Note that (d) represents a statistically non-significant relationship. An extreme outlier was excluded to aid visual representation from (B), (C), and (D), but was included in the analyses. Symbols as in previous figures. Note different scales along y-axis.

