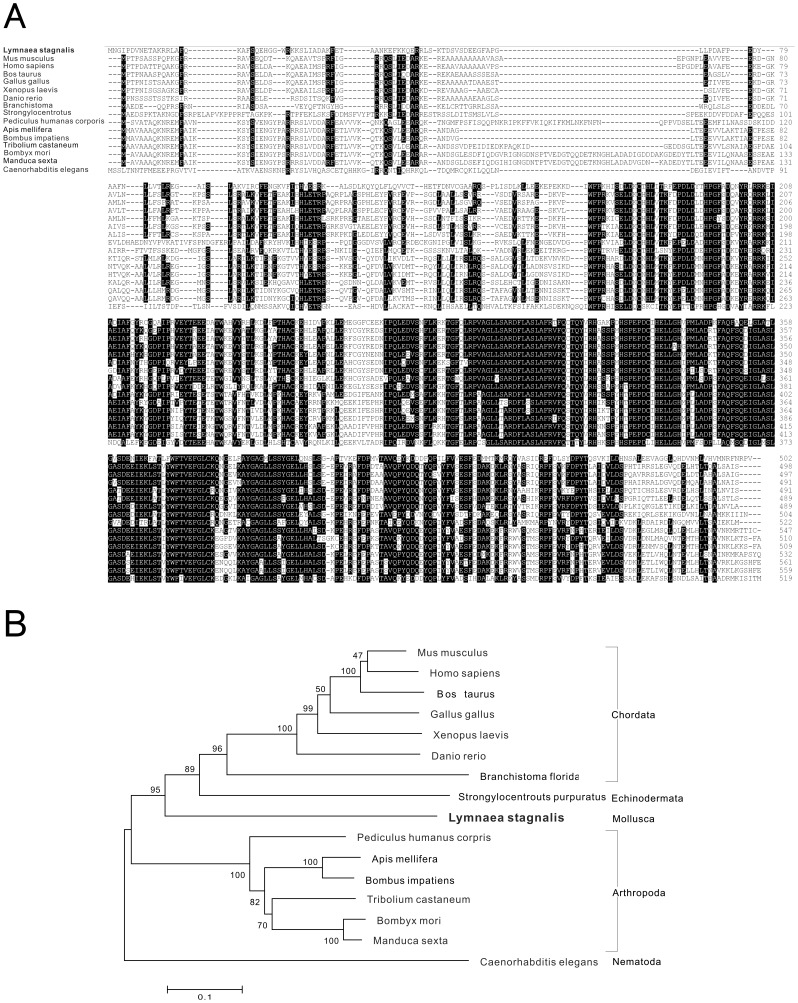
Figure 5. Protein sequence alignment and phylogenetic tree of tyrosine hydroxylase.
Protein sequence alignment of tyrosine hydroxylase (A) and phylogenetic analyses (B) were conducted by the neighbor-joining method using the MEGA4 program with the C. elegans tyrosine hydroxylase as outgroup. The percentage of replicate trees in which the associated taxa clustered together in the bootstrap test is shown next to the branches. The scale bars indicate the estimated evolutionary distance in the units of the number of amino acid substitutions per site.

