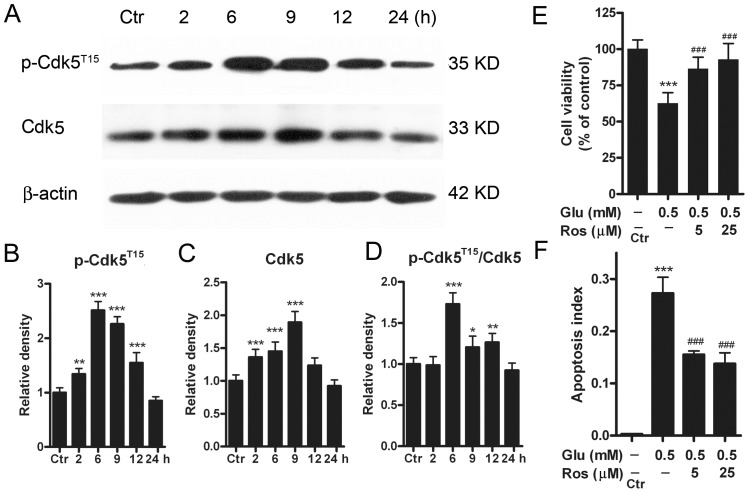
Figure 2. Protein levels of Cdk5 and p-Cdk5T15 in cultured rat retinal neurons following GTs.
(A) Representative immunoblots showing the changes in Cdk5 and p-Cdk5T15 levels in cell extracts obtained from normal (Ctr) and glutamate-treated (0.5 mM for 2, 6, 9, 12 and 24 h) groups. (B, C, D) Bar charts summarizing the average densitometric quantification of immunoreactive bands of p-Cdk5T15 (B), Cdk5 (C) and ratios p-Cdk5T15/Cdk5 (D) in Ctr and glutamate-treated groups, respectively. All data are normalized to their corresponding β-actin data and then to Ctr. n = 6, * p<0.05, ** p<0.01 and *** p<0.001 vs Ctr, one-way ANOVA. (E) Bar chart summarizing the effects of roscovitine (Ros) on glutamate (Glu)-induced cell injury assayed by MTT method. Retinal neurons were incubated with Ros (5 and 25 µM) 30 min prior to a 24 h Glu (0.5 mM) exposure. Note that Ros rescued the Glu-induced decrease of cell viability. n = 5–9, *** p<0.001 vs Ctr; ### p<0.001 vs data obtained in the absence of Ros, one-way ANOVA. (F) Bar chart summarizing the effects of Ros on Glu-induced apoptosis assayed by Annexin V-FITC flow cytometry. Retinal neurons were incubated with Ros (5 and 25 µM) 30 min prior to a 24 h Glu (0.5 mM) exposure. n = 6 for each group, *** p<0.001 vs Ctr; ### p<0.001 vs data obtained in the absence of Ros, one-way ANOVA.

