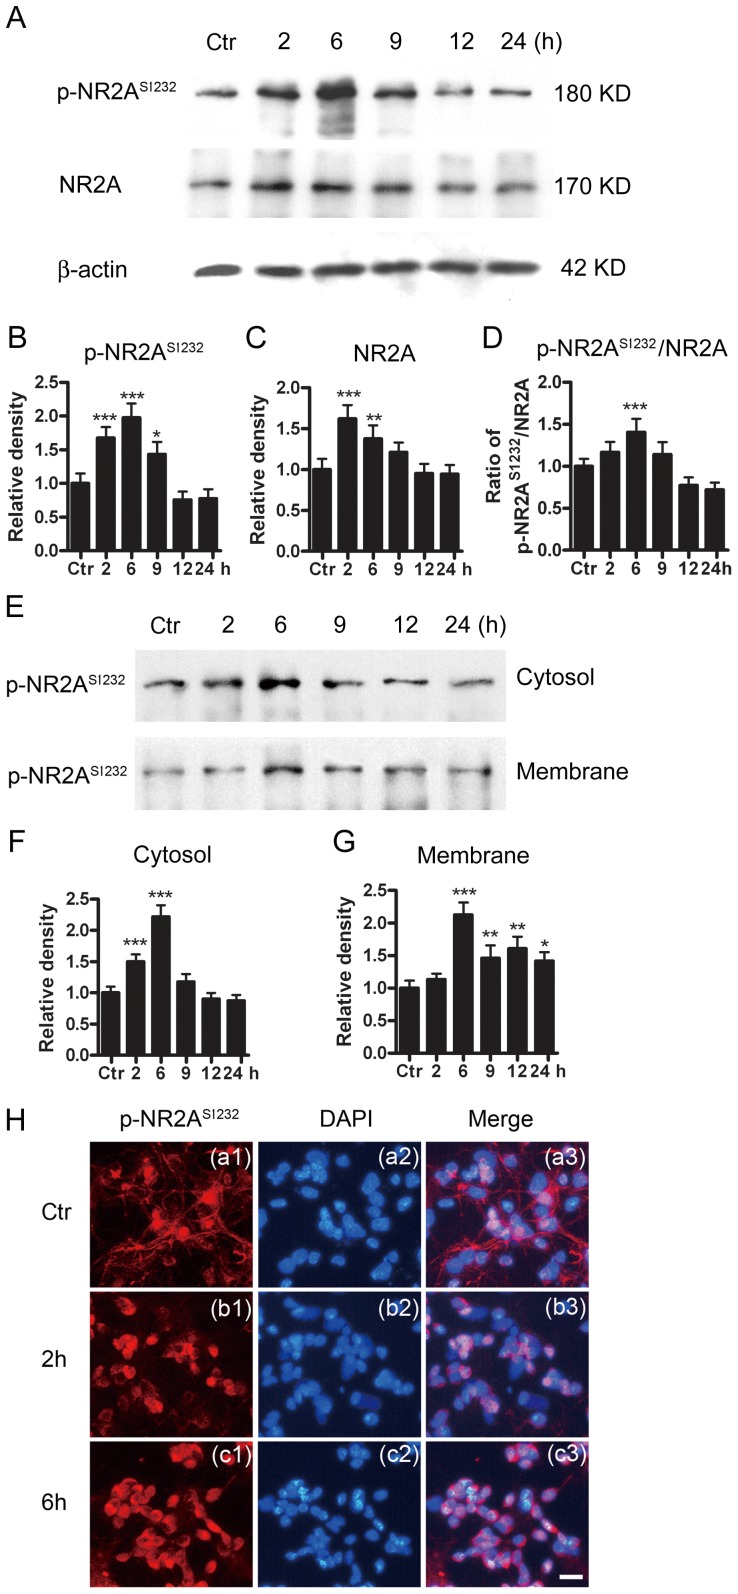
Figure 5. Protein level of p-NR2AS1232 and translocation of p-NR2AS1232 in cultured rat retinal neurons following GT.
(A) Representative immunoblots showing the changes of p-NR2AS1232 and NR2A levels in cell extracts obtained from normal (Ctr) and glutamate-treated (0.5 mM for 2, 6, 9, 12 and 24 h) groups. (B, C, D) Bar chart summarizing the average densitometric quantification of immunoreactive bands of p-NR2AS1232, NR2A and the ratios p-NR2AS1232/NR2A in Ctr and glutamate-treated groups. (E) Representative immunoblots showing the changes in p-NR2AS1232 levels in the cytosol component and cell membrane component extracts obtained from Ctr and glutamate-treated (0.5 mM for 2, 6, 9, 12 and 24 h) groups respectively. (F, G) Bar chart summarizing the average densitometric quantification of immunoreactive bands of p-NR2AS1232 in the cytosol and membrane component extracts obtained from Ctr and glutamate-treated groups respectively. All data are normalized to their corresponding β-actin and then to Ctr. n = 4–6, * p<0.05, ** p<0.01, *** p<0.001 vs Ctr, one-way ANOVA. (H) Glutamate-induced translocation of p-NR2AS1232 in cultured retinal neurons. (a1, b1, c1) Confocal images showing immunofluorescent staining for p-NR2AS1232 in normal (Ctr), glutamate-treated (0.5 mM for 2 and 6 h) cells respectively. (b1, b2, c3) Counterstained images with DAPI. (c1, c2, c3) Merged images of a1 and a2, b1 and b2, c1 and c2 respectively. Note that the cell processes were shrunk following GT (2 h) and GT (6 h), and more p-NR2AS1232 positive signals were detected in the cytosol with GT (2 h), but in the cell membranes following GT (6 h).

