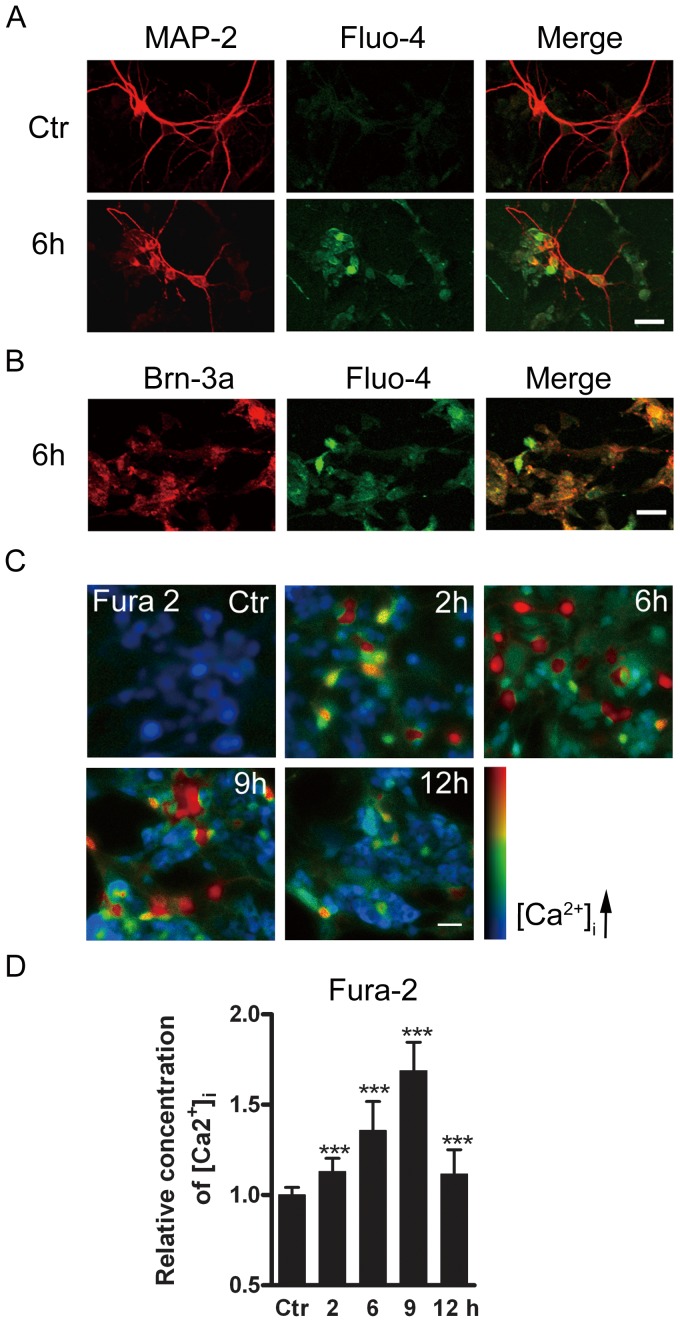
Figure 6. Glutamate-induced increase of [Ca2+]i in cultured retinal neurons.
(A) Confocal images showing immunofluorescent staining with MAP-2 and Fluo-4 in normal (Ctr), glutamate-treated (0.5 mM for 6 h) cells respectively. Note that the cell processes were shrunk following GT (6 h). In the merged images, it was clear that enhanced Fluo-4 signals are localized with MAP-2 positive cells. (B) Confocal images showing immunofluorescent staining for Brn-3a and Fluo-4 in the cells after GT (6 h). Note that enhanced Fluo-4 signals were observed in Brn-3a positive cells following GT (6 h). (C) Images of cultured retinal cells loaded with Fura-2 AM, taken from control cells (Ctr) and cells following GTs (2 h, 6 h, 9 h, 12 h). (D) Bar chart summarizing the changes of [Ca2+]i in control cells (Ctr) and those following GTs (2 h, 6 h, 9 h, 12 h). [Ca2+]i, represented by the ratio of Fura-2 AM fluorescence at 340 nm and 380 nm (F340/F380), is shown in pseudocolor. The data are normalized to control. *** p<0.001 vs Ctr. Scale bar: 20 µm, for all the images.

