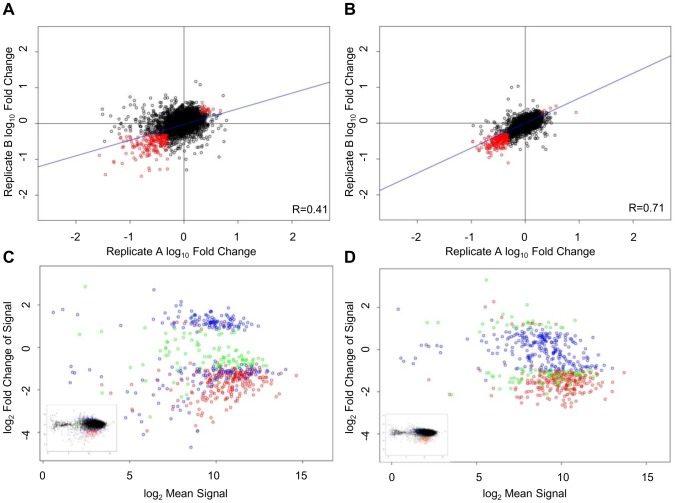
Figure 3. Effect of shRNA fold representation on reproducibility of a HEK293T viability screen using microarray analysis.
Viability screens in HEK293T cells were performed using an average shRNA fold representation of either 100 (S100) or 500 (S500) at transduction and the change of the relative abundance of shRNA in T1 compared to T0 was analyzed by competitive microarray hybridizations. Scatter plot of log10(T1/T0) of the biological replicates of the S100 (A) and S500 (B) screens are shown with Pearson correlation values indicated in the corner of each plot. Probes were filtered to remove those which did not pass T0 signal>two-fold median background. Primary hits (probes that passed fold change criteria of (T1/T0) greater than two and FDR rate of ≤0.05 in both screening (biological) replicates are depicted in red. Signal (log2Mean Signal) for S100 (C) and S500 (D) screens are plotted as a function of log ratio (log2(T1/T0)). Primary hits are color coded with hits identified in both S100 and S500 screens (red), hits identified in the S100 screen only (blue) and hits identified in the S500 screen only (green). The complete data set is presented in the small insert.

