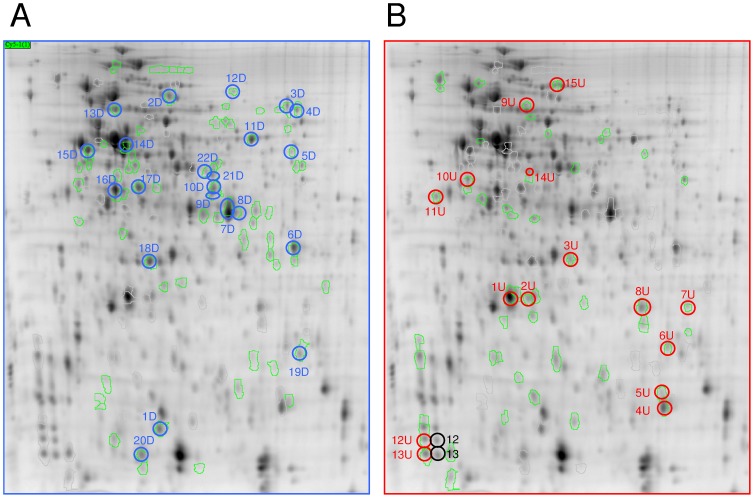
Figure 4. A representative standard 2D gel showing protein spots that were down-regulated (A) and up-regulated (B).
Proteins of interest are circled in green, and excised spots are circled in blue or red according their relative spot volumes (D = down-regulated by UVB; U = up-regulated by UVB). Green circles correspond to the up- or down-regulated proteins not excised for MS analysis.

