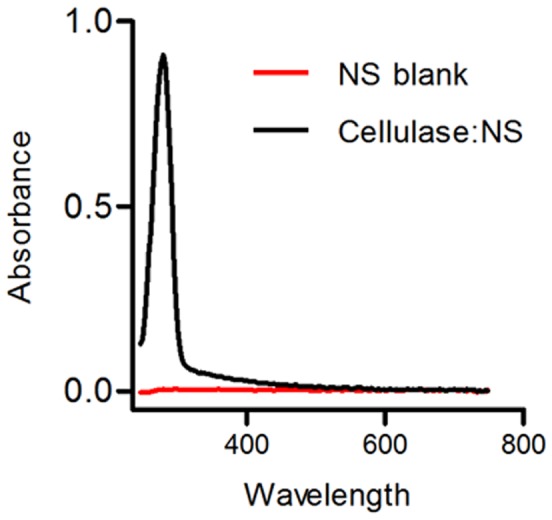
Figure 1. Absorbance spectrum of cellulase:NS complex.

The spectrum of the cellulase:NS complex (black line) was captured after blanking the instrument with NS (red line) that had not been conjugated to cellulase enzymes. The clear peak at 280 nm and lack of additional peaks at absorbance wavelengths higher than 320 nm indicates that there was no interference in the readings from the nanospheres.
