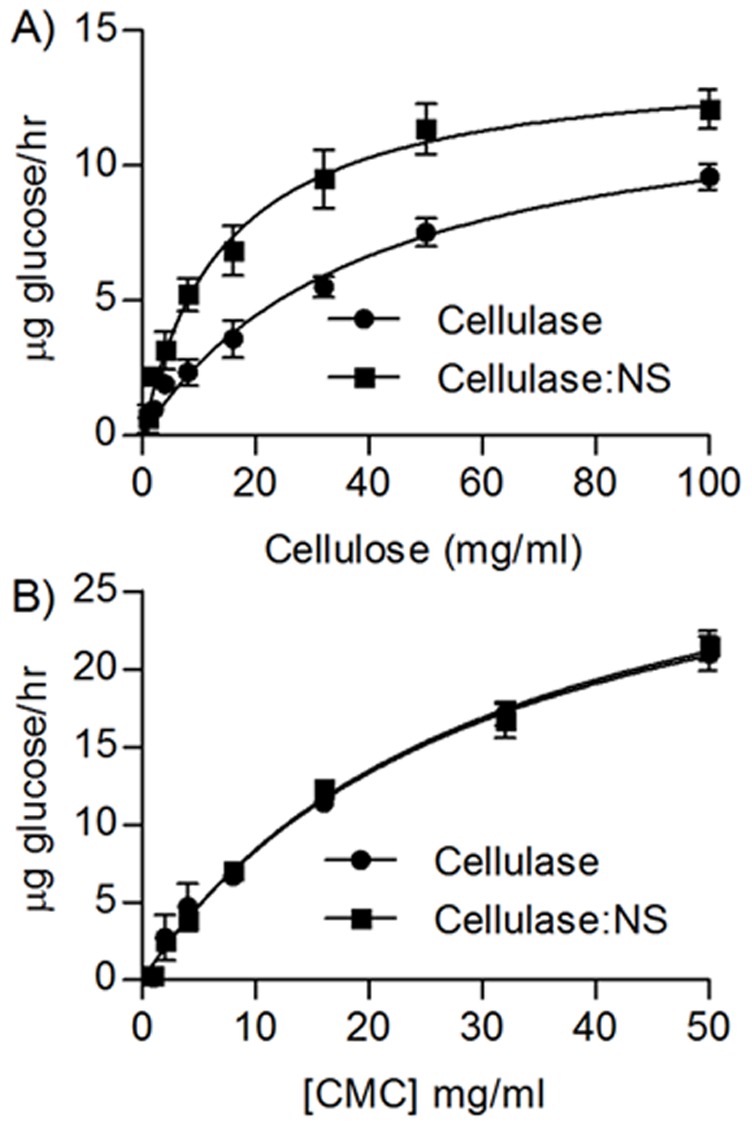
Figure 2. Comparison of cellulase and cellulase:NS enzyme kinetics.

The velocity of glucose release is plotted as a function of A) insoluble cellulose concentration, and B) CMC concentration. Open circles, cellulase; black circles, cellulase-bead complex.
