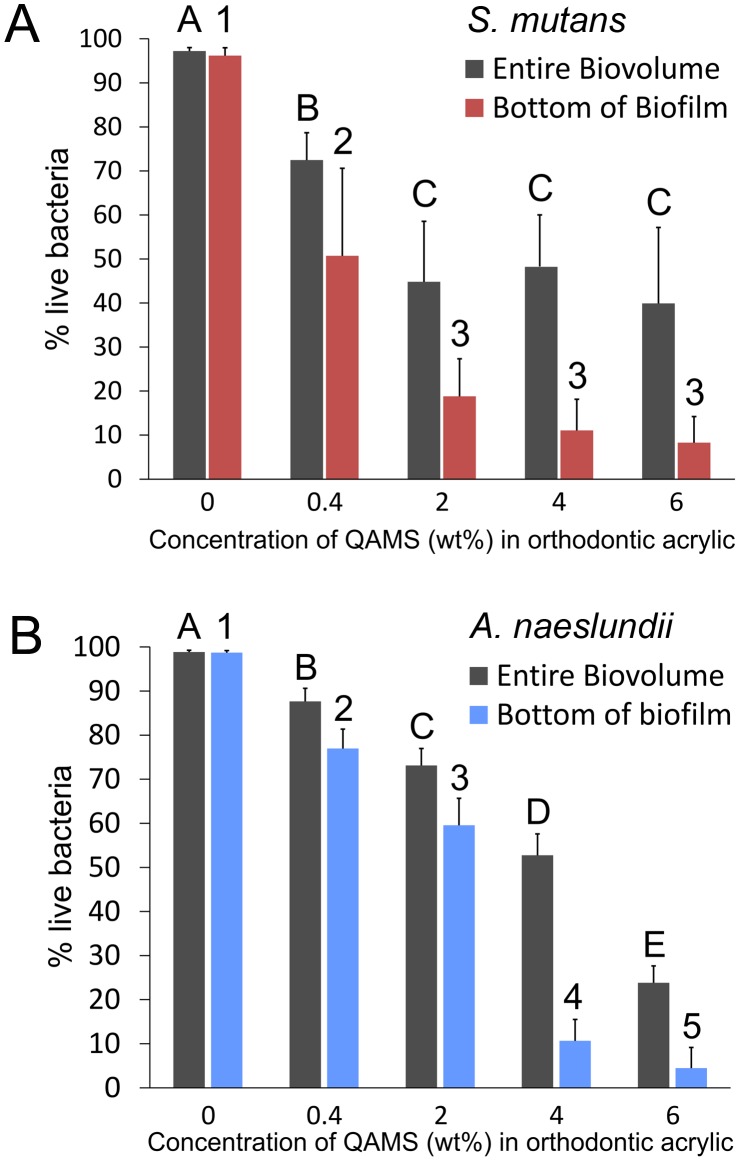
Figure 1. Percentage distribution (mean and standard deviation) of live bacteria within the biovolumes of interest (i.e. the volume of biofilm from the base to the 24th µm of a z-stack), and within the biomass at the basal layer of biofilms that were grown on orthodontic acrylic disks prepared from the control (0 wt% QAMS) and the four experimental groups (0.4–6 wt% QAMS) (N = 6).
A. Streptococcus mutans biofilms. B. Actinomyces naeslundii biofilms. For each parameter (upper case letters for biovolume and numerals for bottom of biofilm), groups labeled with the same category of descriptors (i.e. upper case letters, lower case letters, numeric) are not statistically significant (P>0.05).

