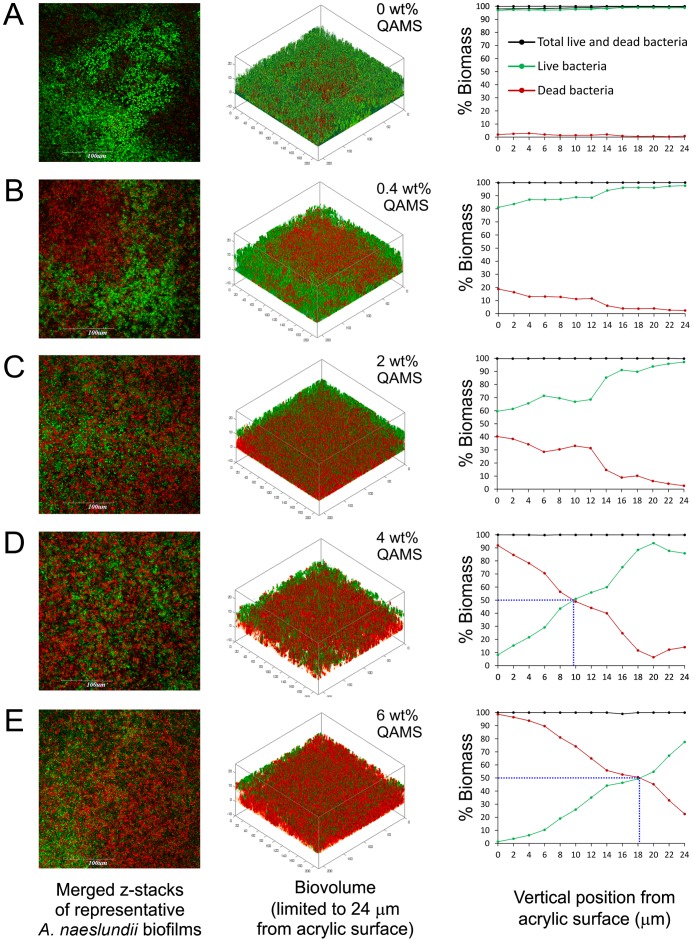
Figure 3. Representative BacLight-stained, 48-h A. naeslundii biofilms grown on the surfaces of orthodontic acrylic resins with different QAMS concentrations.
A. 0 wt%. B. 0.4 wt%. C. 2 wt%. D. 4 wt%. E. 6 wt%. Green: live bacteria; Red: dead bacteria. Column designations are the same as Figure 2. For the scatter plots in the right column of C–E, the blue dotted line denotes the levels with 50% dead biomass.

