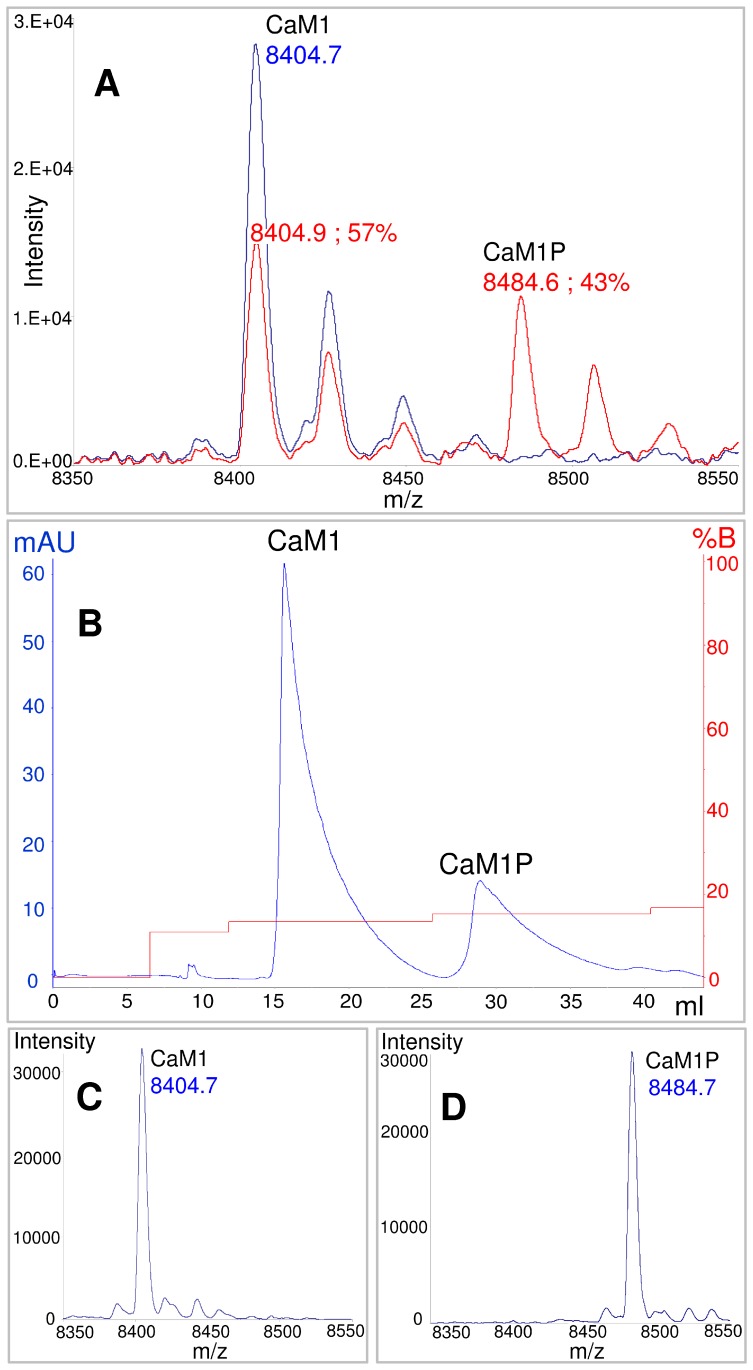
Figure 2. ESI-MS analysis and separation of CaM1 and CaM1P peptides.
A) ESI-MS spectra recorded before (blue line) and 24 h after (red line) the phosphorylation treatment; B) elution profile of the ion-exchange chromatography; C) ESI-MS spectrum of the first purified fraction, corresponding to the non-phosphorylated CaM1 peptide; D) ESI-MS spectrum of the second purified fraction, corresponding to the phosphorylated CaM1P peptide.

