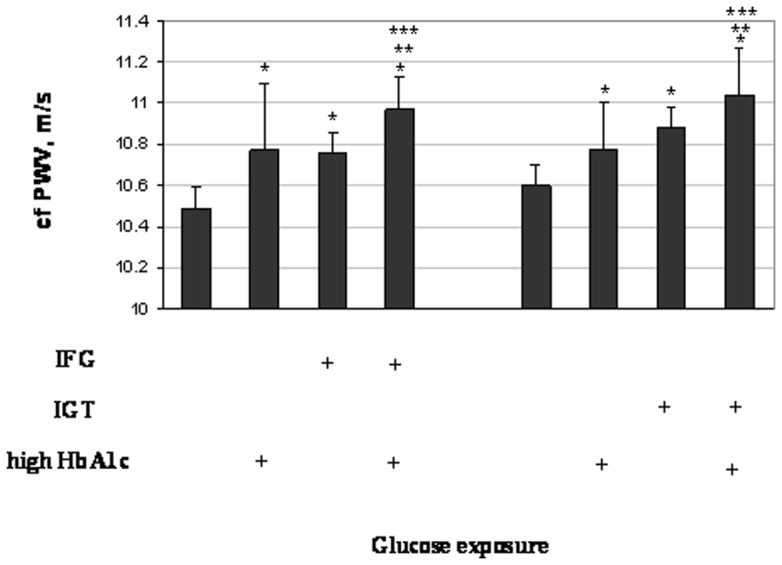
Figure 2. Geometric means of cfPWV (in m/s) by the combinations of high HbA1c (5.7–6.4%) with IFG and IGT.

Symbol ‘+’ represents the presence of the corresponding glucose exposures. The analyses were adjusted for age, sex, BMI, MAP, heart rate and lipids (total cholesterol, triglyceride, HDL-C and LDL-C). ‘*’ represents significant difference (p<0.05) comparing individuals with high HbA1c and IFG/IGT with the normal subjects (without any of these abnormalities); ‘**’ represents significant difference (p<0.05) comparing individuals with high HbA1c and IFG/IGT with those who had only high HbA1c; and ‘***’ represents significant difference (p<0.05) comparing individuals with high HbA1c and IFG/IGT with those who had only IFG or IGT.
