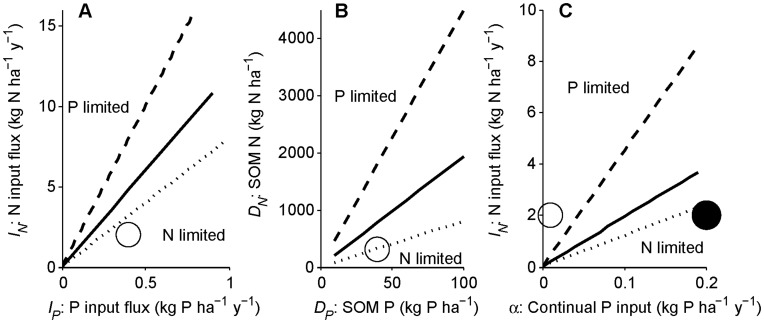
Figure 5. Approximate determination of N versus P limitation at different timescales.
(A) The beginning of the intermediate timescale (beginning of succession), (B) end of the intermediate timescale (end of succession), and (C) terminal steady state (end of long-term ecosystem development) are shown with simplifying assumptions from Table 2 and no symbiotic N fixation. (A) At the beginning of succession there is negligible soil organic matter (SOM), so limitation is determined by input fluxes (the axes), plant demand, and litter N versus P mineralization. The dividing line between N and P limitation (condition 13) is plotted with parameters in Table 1 and 10 kg C ha−1 initial plant biomass (solid line) as well as for high (litter N:P = 20, P:N mineralization rates = 1.5; dashed line) and low (litter N:P = 8, P:N mineralization rates = 1; dotted line) parameter values. The circle represents parameters in Table 1. Ecosystems with high rock P inputs would be at the right end of the panel. Ecosystems with high N deposition would be near the top of the panel. (B) At the end of succession, mineralization from SOM far exceeds the balance of abiotic inputs and losses in unpolluted ecosystems, so N versus P limitation is determined by SOM N and P (the axes), plant N:P demand, and the mineralization of litter and SOM N versus P (condition 15). The lines are as in (A), and the circle is the initial SOM N and P in Fig. 2. (C) At the terminal steady state, N versus P limitation is determined by the balance of continual inputs and losses, plant N:P demand, and the mineralization of litter and SOM N versus P (condition 18). Axes are N and P input fluxes. Lines and open circle as in (A), with the closed circle indicating the input fluxes for Fig. 4.

