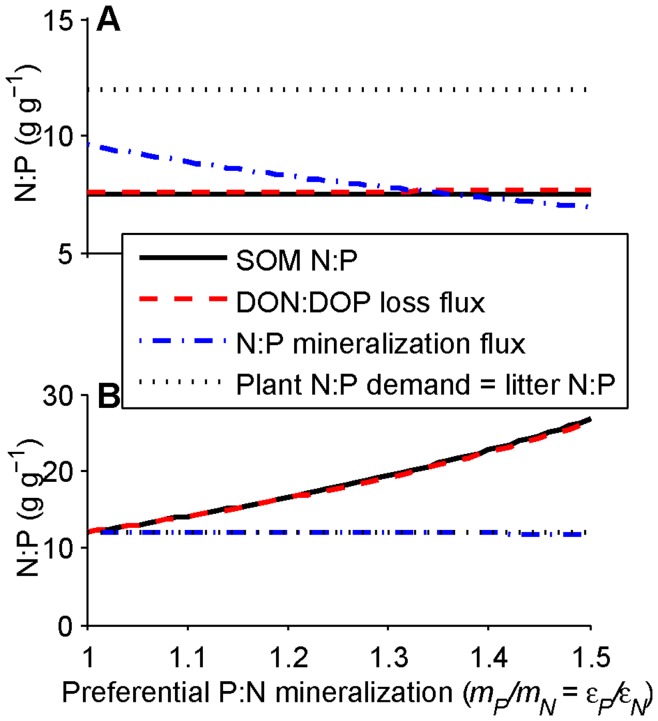
Figure 6. Effects of preferential P versus N mineralization.
Effects are different for the (A) intermediate and (B) long timescales. Parameters are from Table 1 except for the mineralization rates mN and mP and the fractions of litter N and P decomposition mineralized, εN and εP, which vary to give the ratios along the horizontal axis. Timescale approximations of soil organic matter (SOM) N:P (solid black line), N:P losses of plant-unavailable nutrients from SOM and litter combined (termed DON:DOP in the legend for brevity, but in reality incorporating dissolved and particulate hydrologic losses and erosion losses; red dashed line), N:P mineralization fluxes from SOM and litter combined (blue dashed-dotted line), and plant N:P demand (black dotted line; which here is equivalent to P use efficiency:N use efficiency, litter N:P, and plant uptake) are plotted. The near-1∶1 correspondence between SOM N:P and DON:DOP stems primarily from the equivalence of φN and φP, which is not always true (see Table 2 and [37]). However, any monotonic relationship would yield the same timescale dynamics exhibited here.

