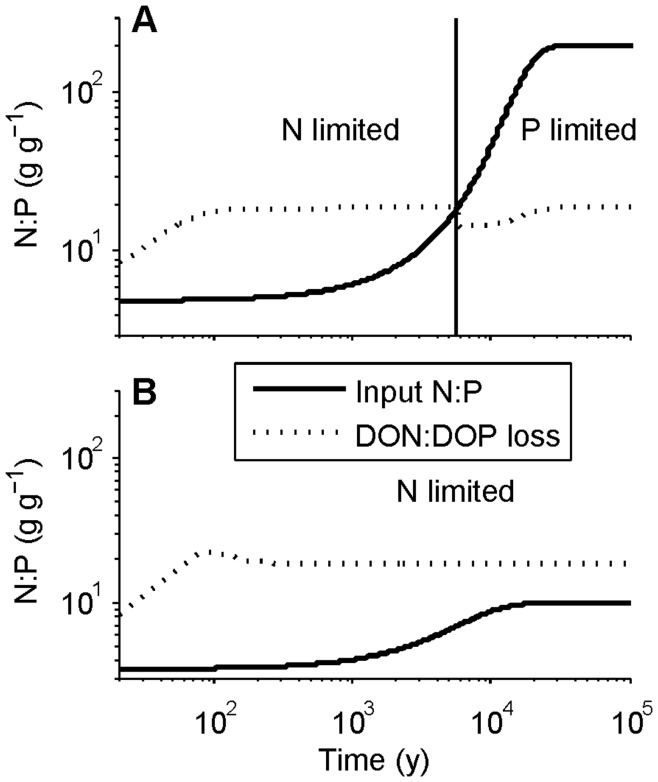
Figure 7. Contrasting effects of inputs versus losses in determining N versus P limitation over long timescales.
Effects are shown for simulations in (A) Fig. 2 and (B) Fig. 4. The N:P ratio of plant-unavailable losses (termed DON:DOP in the legend for brevity, but in reality incorporating dissolved and particulate hydrologic losses and erosion losses; dotted lines) increases over decades due to preferential P mineralization (see Fig. 6), increasing the likelihood of N limitation over the intermediate and the beginning of the long timescales. On millennial and longer timescales the input N:P ratio increases due to the decline in P weathering, increasing the likelihood of P limitation over very long timescales. The transition time from N to P limitation in Fig. 2 corresponds to the crossing of the input and loss N:P ratio lines in (A) (indicated by the vertical line), which is controlled primarily by the weathering rate (see Fig. 8). In Fig. 4 and (B) there is no transition to P limitation over long timescales because the input N:P remains lower than the DON:DOP loss ratio, despite increases in both. The condition for whether limitation switches from one nutrient to the other is given in conditions 14, 15 and 18 (also see Fig. 5). The dip in the DON:DOP loss ratio when the input and loss line cross (when limitation switches) in (A) is an artifact of the timescale separation approximation–it remains constant at its saturation level in the full numerical integration (results not shown)–but all other trends reflect the true dynamics of the system. Note that both axes are logarithmic.

