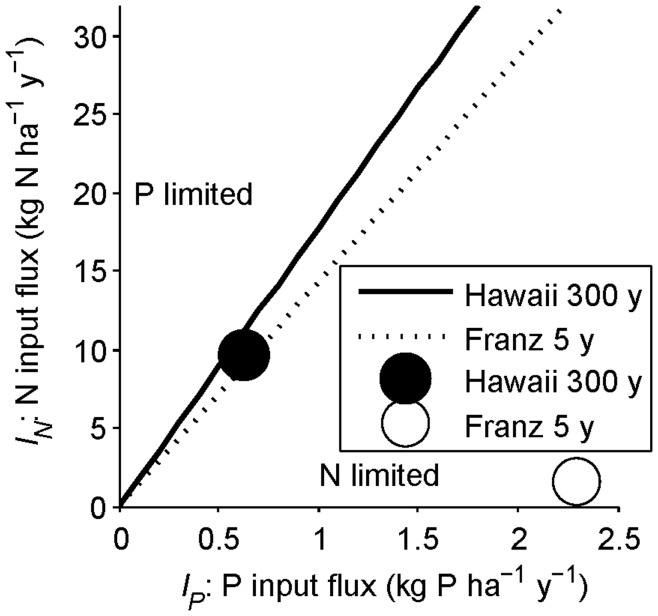
Figure 9. Model predictions for N vs. P limitation in the youngest Hawai’i and Franz Josef sites.
Axes and equations are as in Fig. 5, but with Hawai’i in a solid line and closed circle and Franz Josef in a dotted line and open circle. At the beginning of primary succession the Hawai’i site would be N limited but fairly close to co-limitation, whereas the Franz Josef site would be strongly N limited without any symbiotic N fixation. Input and nutrient use efficiency parameters come from the 300 year old Hawaiian site (IN = 9.6 kg N ha−1 y−1, IP = 0.63 kg P ha−1 y−1, ωN = 382 g C g N−1, ωP = 6780 g C g P−1 [37]) and the 5–7 year old New Zealand site (IN = 1.5 kg N ha−1 y−1 [78], IP = 2.2 kg P ha−1 y−1–calculated from the decrease in soil inorganic P from the 5 to the 60 year old site–ωN = 45 g C g N−1, ωP = 643 g C g P−1 [5]), with the other parameters as in Fig. 5a.

