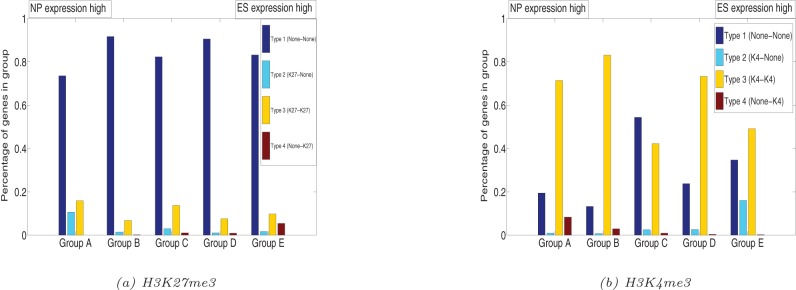
Figure 10. Gene profile according to expression and histone modifications.
Genes are grouped in (A–E) according to increasing ratio of expression level in ES cells and NP cells. Within each groups, genes are classified into 4 types. Type 2 genes have differential histone enrichment in ES cells in their promoter regions and type 4 genes have differential enrichment in NP cells. (a) Percentage of type 2 genes is decreasing, while percentage of type 4 genes is increasing along the group (A–E). (b) Percentage of type 2 genes is increasing, while percentage of type 4 genes is decreasing along the group (A–E).

