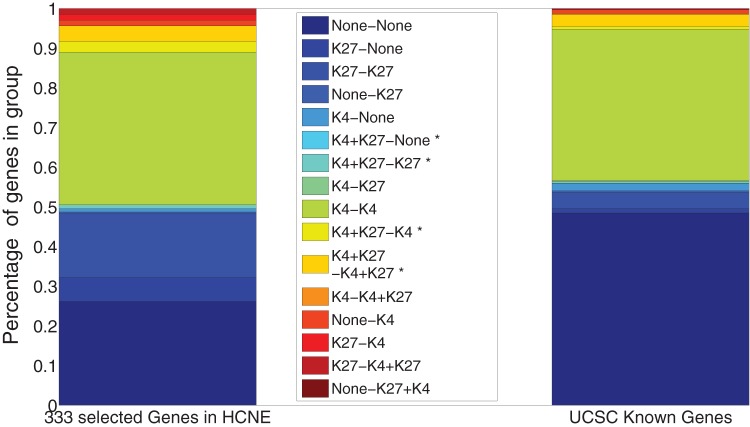
Figure 11. Bivalent regions in genes; (a) in 333 selected genes; (b) in UCSC known genes.
Genes are attributed to classes according to the presence of modifications in ES and NP cells. The “A–B” notation in the labels indicates the presence of modification of type “A” in ES cells and modification of type “B” in NP cells. (*) marked labels have bivalent domains in ES cells.

