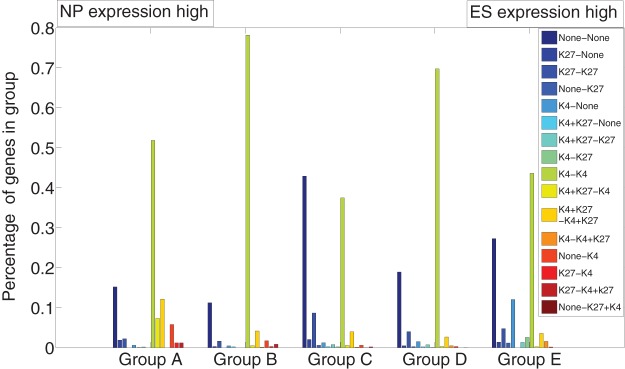
Figure 12. Bivalent gene profile vs. expression data.
Genes are grouped in (A–E) according to increasing ratio of expression level in ES cells and NP cells. Each bar shows the percentage of genes with the corresponding “A–B” modifications (as listed in the box), “A” for modifications in ES cells and “B” for modifications in NP cells. It is seen that there is a strong over-representation of the K4+K27-K4 transition (yellow) in the genes class, which is strongly up-regulated in NP cells.

