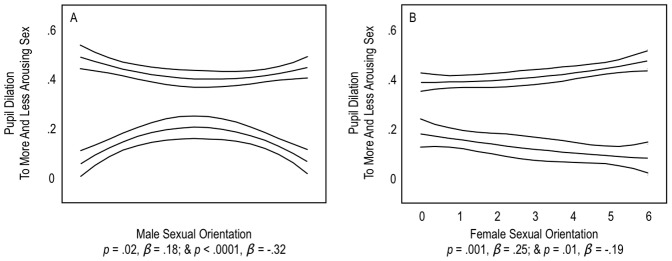
Figure 2. Pupil dilation to the more arousing sex and less arousing sex.
Panel A shows men’s responses and Panel B shows women’s’ responses to the more arousing sex (i.e., more dilation-eliciting sex; upper lines) and the less arousing sex (lower lines). Y Axes reflect, within participants, z-scores compared to a neutral stimulus. X Axes reflect self-reported sexual orientation: 0 represents an exclusive heterosexual orientation, 3 an even bisexual orientation, and 6 an exclusive homosexual orientation. Triple lines represent regression coefficients with 95% confidence intervals. β’s are, for men, standardized coefficients for curvilinear effects, and, for women, standardized coefficients for linear effects.

