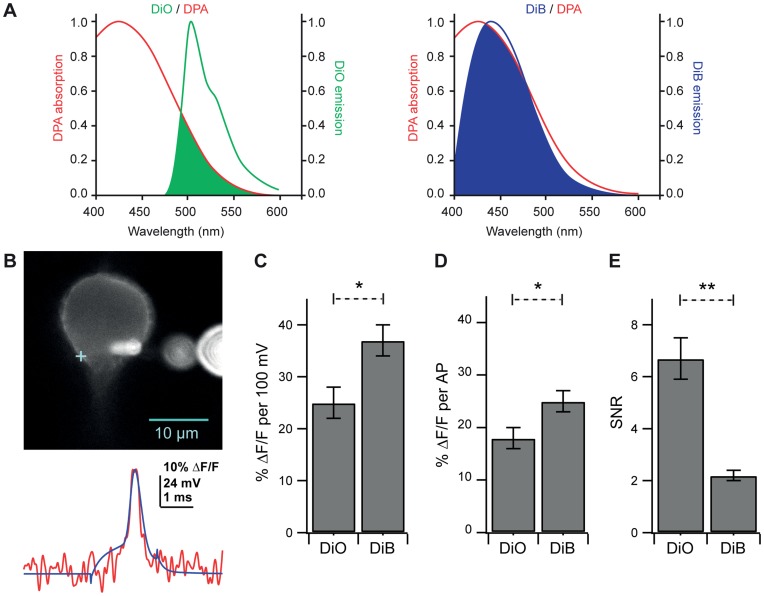
Figure 6. A blue-shifted fluorescence donor increases fAP amplitude but exhibits a decreased SNR. A.
Single-photon fluorescence emission spectra of DiO (left, green line) and DiB (right, blue line) overlaid with the excitation spectrum of DPA. Overlap between the emission spectra of the fluorescence donors and the FRET acceptor (DPA) is depicted by the shaded areas of each plot. Note the greater overlap between the emission spectrum of DiB and the excitation spectrum of DPA. B. Upper: Confocal image without pinhole of a Purkinje cell patch-labeled with DiB and illuminated with 375 nm laser light. The cross indicates optical recording location. Extracellular fluorescent orbs are out-of-focus dye crystals in the patch pipette. Lower: Optical trace (red) of averaged (12 traces) voltage measurements overlaid with average of simultaneously recorded APs (blue trace) evoked by brief current pulses. C. Comparison of % ΔF/F per AP in cells loaded with DiO (18±2% ΔF/F, 488 nm illumination) and cells loaded with DiB (25±2% ΔF/F, 375–405 nm illumination). D. Comparison of % ΔF/F per 100 mV in cells loaded with DiO (25±3% ΔF/F) and cells loaded with DiB (37±3% ΔF/F). E. Comparison of SNR between cells loaded with DiO (6.7±0.8) and cells loaded with DiB (2.2±0.2). Bars in C-E represent the mean ± SEM.

