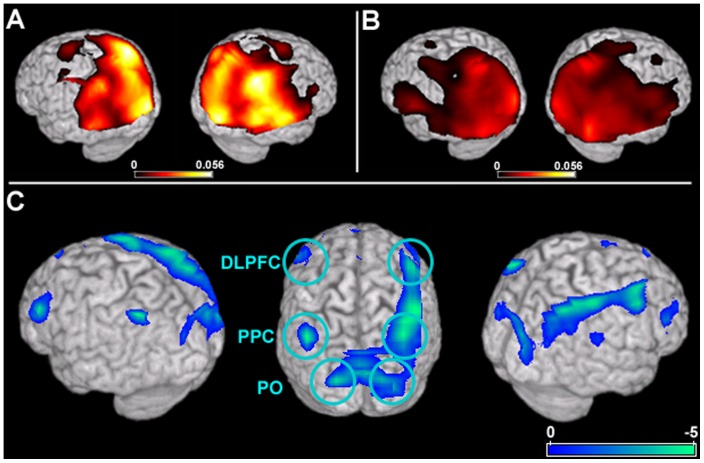
Figure 2. Alpha band (8–12Hz) global connectivity (GC) maps for the HC and AgCC groups and results from a direct comparison between the two samples.
In both HC (A) and AgCC (B) groups, high resting-state alpha GC is seen across the occipital, parietal and temporal lobes. In the group contrast, three regions are identified as being significantly underconnected across both hemispheres in the patient group. GC within a region of dorsolateral pre-frontal cortex bilaterally (DLPFC; in blue) is lower in the AgCC group. A cluster of voxels in posterior parietal cortex (PPC; in blue) are significantly underconnected in both hemispheres of patients with AgCC. Caudal to PPC, a region of parieto-occipital cortex (PO) was also disconnected in both hemispheres in the AgCC group. Statistical maps are thresholded (p<0.05, FWE corrected) and superimposed over a rendering of the MNI template brain.

