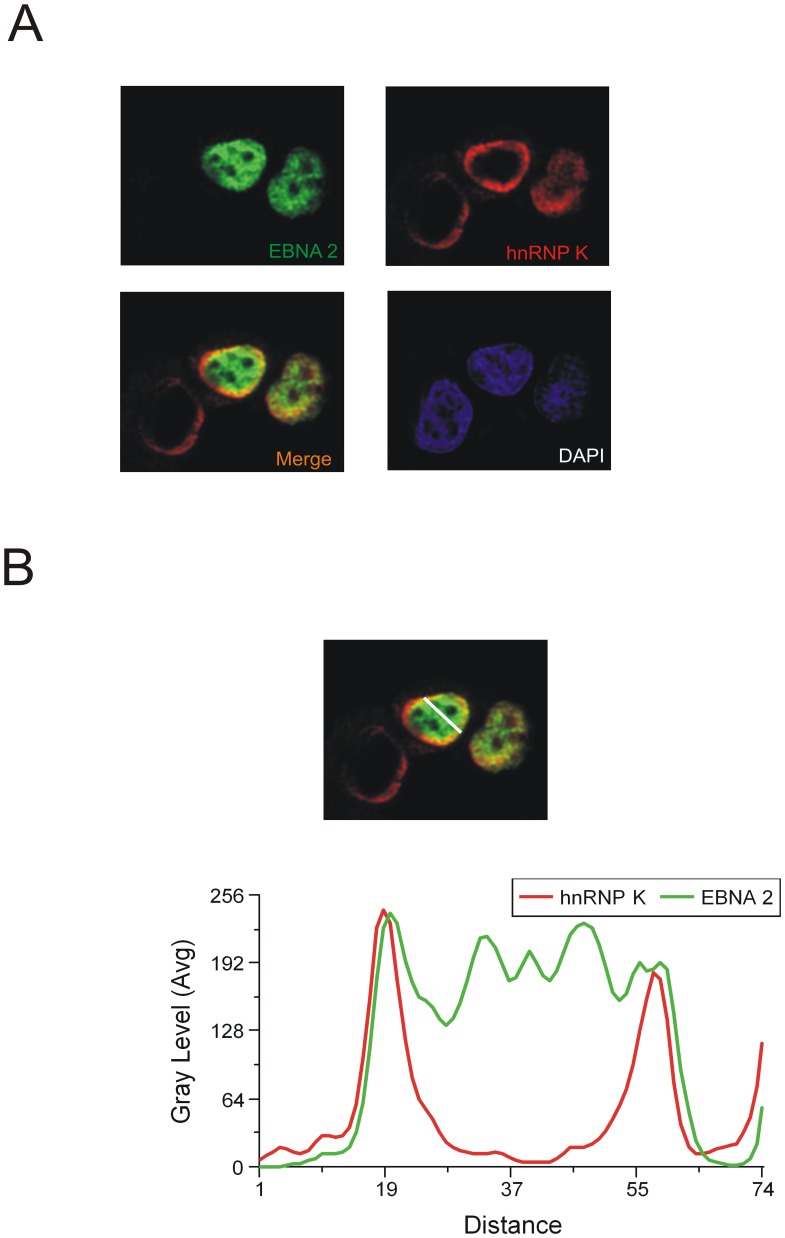
Figure 6. hnRNP K and EBNA2 co-localize in transiently transfected cells.
(A) HeLa cells transfected with EGFP- EBNA2 were analysed by confocal laser scanning microscopy. Endogenous hnRNP K was detected using the monoclonal D-6 antibody and an Alexa 647 coupled anti mouse antibody. The signals for hnRNP K (red) or EBNA2 (green) are shown. The merged signals show co-localisation of hnRNP K and EBNA2, resulting in a yellow color. Also shown is the DAPI staining of DNA. The fluorescence profiles of hnRNP K and EBNA2 (B) at a co-localisation hotspot (indicated by the line, left picture - lower lane) were analysed with the Leica MMAF software. The signals for hnRNP K and EBNA2 show the same progression of intensity at the inner nuclear membrane.

