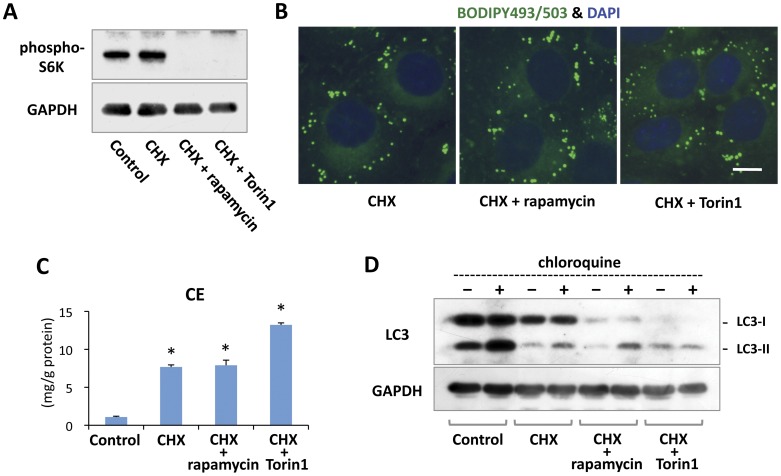
Figure 5. CHX induced increases in LDs and CE even in the presence of mTORC1 inhibitors.
(A) 3Y1 cells were treated without or with 10 µg/ml CHX, 10 µg/ml CHX and 0.4 µM rapamycin, or 10 µg/ml CHX and 0.25 µM Torin1 for 8 hr. Addition of rapamycin or Torin1 decreased phospho-S6K significantly. GAPDH is shown as a loading control. Each lane was loaded with 20 µg protein. (B) 3Y1 cells were treated with 10 µg/ml CHX alone or together with 0.4 µM rapamycin or 0.25 µM Torin1 for 18 hr. LDs increased to a similar degree irrespective of the presence of rapamycin or Torin1. Bar, 10 µm. (C) 3Y1 cells were treated without or with 10 µg/ml CHX, 10 µg/ml CHX and 0.4 µM rapamycin, or 10 µg/ml CHX and 0.25 µM Torin1 for 18 hr. CE increased in response to CHX treatment even when rapamycin or Torin1 was given simultaneously. Mean ± SD is shown. The difference from the control sample was examined by Student’s t test (*p<0.01). (D) 3Y1 cells were treated in the same manner as in Fig. 5A. The autophagic flux was examined by adding 20 µM chloroquine for 1 hr immediately before sample preparation. A low level of LC3-II increase was caused by chloroquine in samples treated with CHX alone or CHX and rapamycin, but not in samples treated with CHX and Torin1. GAPDH is shown as a loading control. Each lane was loaded with 50 µg protein.

