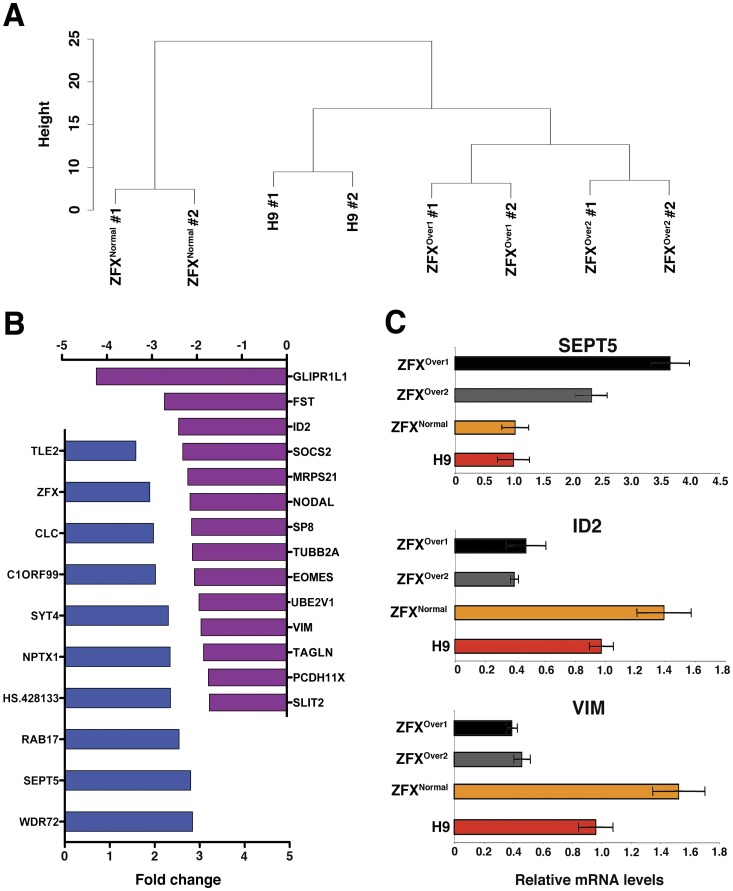
Figure 6. Gene expression analysis of ZFXOver clones compared to controls.
Two independent samples of Tra1-81HI/SSEA-3HI hESCs were isolated from ZFXOver clones, ZFXNormal and H9 hESC array analysis. A. Dendrograms of each cell line after clustering analysis. B. Up- and down-regulated genes in ZFXOver compared to H9 using an adjusted p-value of 0.05 as a cutoff. C. Quantitative PCR validation of selected genes on the array.

