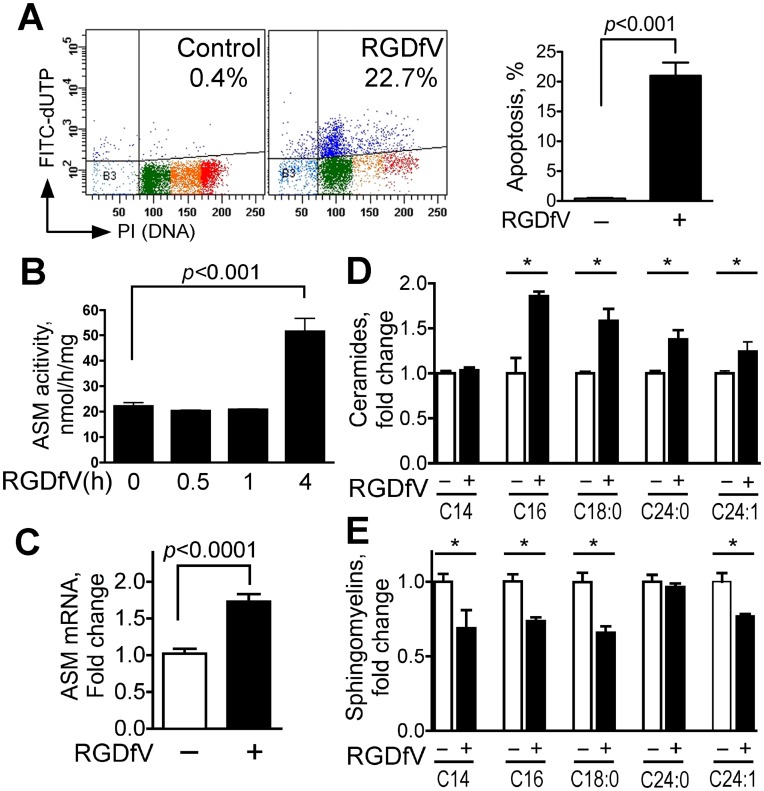
Figure 1. RGDfV increases ASM mRNA, ASM activity and ceramide levels and decreases sphingomyelins.
A) Apoptosis (Apo-Direct kit) in ECV-304 cells treated with vehicle or RGDfV (5 µg/ml; 48 hrs). Left panel: representative flow cytometry plots showing percentage of apoptotic cells (FITC-dUTP positive cells in the two upper quadrants; dark blue dots). Color dots in the lower quadrants represent position in the cell cycle of the non-apoptotic cells based on DNA content (propidium iodide). Light blue is sub G0, green is G1, orange is S-phase and red is G2/M. Right panel: mean±SEM apoptotic (dark blue) cells of 24 independent experiments. B) ASM activity (Echelon Biosciences kit) in extracts from ECV-304 treated with vehicle or RGDfV (5 µg/ml). Shown are mean±SEM of three independent experiments. C) Real time quantitative RT-PCR for ASM from ECV-304 cells treated with vehicle or RGDfV (24 hrs). Shown are mean±SEM ASM mRNA normalized to GAPDH, depicted as fold-increase compared to baseline from 16 independent experiments performed in 1–4 replicates each. D–E) Change in ceramide (D) and sphingomyelin (E) content in extracts from ECV-304 cells incubated with vehicle or RGDfV (5 µg/ml; 24 hrs) and analyzed by mass spectrometry. Bars represent mean±SEM fold change from control in one of two experiments with similar results, each of which was performed in 3 biological triplicates and analyzed in duplicates.

